Showing posts with label NOAA. Show all posts

Friday, 2 August 2019

2019 - Temperatures to June

Here is a summary of the first half of 2019 for each of my monitored data sets, and my simple statistical predictions for the year.

The headline is that so far all data sets are showing 2019 so far to be hot, one of the warmest on records. My prediction is that 2019 is unlikely to be as warm as the record breaking 2016, but is very likely to be warmer than 2018, and is going to at least be in the top 5 warmest years.

This table summarizes each data set, showing the average anomaly (in °C) for the first 6 months of the year, compared to each data sets specified base period. It shows my simple prediction for the final 2019 value, along with the 95% range of predicted values. Finally it shows the expected ranking, that is the position 2019 will be if the final yearly value was as predicted. This doesn't show how close this would be in some cases.

Data Set Average Base Period Prediction Lower Upper Rank
UAH 0.39 1981 - 2010 0.37 0.28 0.46 4th
RSS 0.71 1979 - 1998 0.70 0.61 0.79 2nd
GISTEMP 0.98 1951 - 1980 0.94 0.85 1.03 2nd
NOAA 0.94 1901 - 2000 0.91 0.82 1.00 3rd
BEST 0.93 1951 - 1980 0.89 0.80 0.98 2nd
HadCRUT 0.73 1961 - 1990 0.71 0.62 0.81 3rd

For all data sets except UAH, the range of predicted values suggest 2019 is likely to be between 1st and 4th warmest - though the chances of finishing first is generally pretty low, less than 5%. UAH is likely to be between 3rd and 5th warmest.

The next table shows the probability of each data set beating the various rankings. Note, these are cumulative probabilities, so "3rd" for example is the probability of finishing 3rd or higher. Percentages are given to 1 or 2 decimal places as appropriate. An asterisk indicates the rank of 2018.

Data Set Expected Rank 1st 2nd 3rd 4th 5th
UAH 4th 0.06% 0.76% 24.6% 82.1% 98.4%
RSS 2nd 4.4% 80.5% 96.4% 99.0% 99.3%
GISTEMP 2nd 4.4% 65.1% 82.1% 97.8% * 100%
NOAA 3rd 3.8% 35.4% 55.3% 97.5% * 99.98%
BEST 2nd 2.6% 72.9% 87.2% 98.0% * 99.99%
HadCRUT 3rd 3.5% 13.6% 78.0% 99.3% * 99.8%

Here's the averages and predicted value converted to the same base period (1981 - 2010).

Data Average Prediction
UAH 0.39 0.37
RSS 0.57 0.56
GISTEMP 0.53 0.52
NOAA 0.48 0.47
BEST 0.51 0.50
HadCRUT 0.42 0.42

It's interesting to note that using the later base period has moved the annual predictions closer to the average for the year to date. There's virtually no difference between the prediction and the average, so if true we should expect temperatures for the rest of the year to be only slightly lower than for the first 6 months. I suspect this won't be the case, as ENSO conditions change, and so I wouldn't be surprised if the final temperature is lower than my current predictions.

Some graphs illustrating some of the predictions.

What I find astonishing, and worrying, about all this is not so much the rankings of individual years, but the persistence of the current warm spell. Assuming the predictions for 2019 are not wildly wrong, by the end of the year we will be seeing all surface data sets showing the last 5 years have been the 5 warmest on record, and satellite data showing that the last 5 years have been amongst the 7 warmest on record.

Sources

The above is based on data from the following sources:

UAH
The University of Alabama in Huntsville
RSS
Remote Sensing Systems
GISTEMP
NASA Logo, National Aeronautics and Space Administration National Aeronautics and Space Administration Goddard Institute for Space Studies
NOAA
National Oceanic and Atmospheric Administration
BEST
Berkeley Earth
HadCRUT
Met Office Hadley Centre

Tuesday, 2 April 2019

February 2019 Global Temperature Update

Another brief summary of all the main global temperature data sets for February 2019. As before all anomalies have been recalculated to be relative to the 1981-2010 base period, which may mean that relative changes are different.

February was another month with little change. All data sets show the average temperature as being somewhat warmer than the base period, with anomalies around one third to a half a degree warmer. This is similar to the anomaly for January in most cases, but with HadCRUT and NOAA being around 0.1°C cooler. Compared with last February all data sets show this February being warmer, by around 0.1°C.

February
Dataset Anomaly Change from Last Month Change from Last Year Trend Since 1979 (per Century)
BEST 0.45 0.02 0.06 1.87
GISS 0.45 0.03 0.08 1.73
HADC 0.33 -0.09 0.14 1.7
NOAA 0.32 -0.11 0.09 1.63
RSS4 0.51 -0.01 0.16 1.98
UAH6 0.36 -0.01 0.16 1.28

February 2019 was between the 3rd and 6th warmest February depending on the data set. Here a couple of graphs showing temperatures for the month of February. (Note the scale for GISTEMP is to the 1951-1980 average.)

Predictions

With not much change in the monthly anomalies, and these being close to the warming trend, there hasn't been much change in my predictions. The mid point prediction is virtually unchanged, at most down a few hundredths of a degree. All sets are suggesting there is a good chance of 2019 being warmer than 2018, but with only a small chance of being warmest. The biggest changes from last month is that all sets have reduced the probability of an absolute warmest year, simply because of the slightly narrower prediction intervals.

January - Predictions
Dataset Prediction Interval Top 5 Warmer Than 2018 Record Warmest
BEST 0.44 ±0.13 97.0% 71.0% 2.0%
GISS 0.44 ±0.13 97.5% 71.1% 2.4%
HADC 0.40 ±0.14 95.3% 92.8% 7.5%
NOAA 0.41 ±0.12 94.9% 84.1% 5.3%
RSS4 0.50 ±0.14 80.2% 95.8% 2.5%
UAH6 0.32 ±0.14 76.0% 91.3% 0.4%

A few graphs.

Final Observation

The fact that February was so warm might have came a shock to those who had been a very cold February, especially in the Northern Hemisphere. Here for example is an article on Watts Up With That, Amid the dimmest Sun since 1978 – a month without sunspots, from the 1st March claiming low sunspot numbers were causing severe winters.

It seems the sun has dimmed more than the usual amount at the end of solar cycle 24, and it could be a factor in the severe winter we are experiencing in many parts of the northern hemisphere.

But of course, cold winters in parts of the USA do not mean cold everywhere. Some parts of the Northern Hemisphere, such as the UK, were experiencing extremely warm, even record breaking, temperatures during parts of February, and even some parts of the USA, such as Florida, were very hot.

So strong was the conviction that February was going to be cold that when the UAH data was published in WUWT, here, showing Northern Hemisphere temperatures were 0.46°C above average, the comments erupted in accusations about the unreliability of satellite data, some even suggesting fraud and corruption. For example

Sorry, but this presentation does not pass the BS smell test. The northern hemisphere was featured in story after story about cold records, snow records, lake ice jams, etc, and in the southern hemisphere (where I live) producers are struggling with a decent harvest, which does not suggest a normal summer temperature. This all just does not add up to believable. Can somebody familiar with the data sets figure out what is wrong? Otherwise, I’m going with the obvious: BS!

How is this thing supposed to be measuring temperature? This is for the month of Feb, right?

We have had almost the coldest Feb on record…..we’re 61F right now….when we should be high 70’s to low 80’s

…and it says we’re +2 for the month

Something is definitely wrong…..

Que the usual apologist clergy to lie away the discrepancy.

This is why the contrarians here who constantly defend the constant adjustments and lie about temperature are lying liars who deserve no respect and no polite interaction. Denver Colorado was disastrously cold this year, significantly below average. This is pure Orwellian horse crap

It's all a long time (About 4 years) from the time when anyone who questioned the accuracy of satellite data was branded a satellite-denier.

And next months data from UAH is using an adjusted version showing slightly more warming.

Thursday, 7 March 2019

Temperatures - January Summary

Belatedly here's a brief summary of all the reports of global temperatures for January 2019.

I'm trying a different format this year, and only intend to release single reports for all the main data sets at the end of each month, when all the data is in. One major change is that I want to use a consistent base line, so all anomalies are translated into anomalies relative to the years 1981-2010. I'm not promising I will keep this up all year - it might depend on how much I can automate the work.

Observations

All surface data sets have January at around 0.4 - 0.45°C warmer than the 1981-2010 average, with satellite data not too dissimilar. UAH was a bit below 0.4°C and RSS a bit above 0.5°C. In all cases this is up around 0.1°C compared with last January. UAH have 2019 as the 6th warmest January, all other data sets have it as the 4th warmest.

This table summarizes some of the details

January
Dataset Anomaly Change from Last Month Change from Last Year Trend Since 1979
BEST 0.44 -0.03 0.08 1.88
GISS 0.43 -0.06 0.11 1.71
HADC 0.41 0.08 0.18 1.71
NOAA 0.43 0 0.16 1.64
RSS4 0.52 0.12 0.11 1.98
UAH6 0.37 0.12 0.11 1.28

Hopefully that's not too confusing. It shows each data set, with the anomaly for January in Celsius compared with the 1981 - 2010 base period. It also shows the change of that anomaly compared with the previous month (December 2018) and compared with the same month last year (January 2018). Finally it shows the trend since 1979 in Celsius per century. 1979 is used as a start date for consistency with the satellite data.

Predictions

Too soon to take any predictions seriously, but on the basis of one month the prediction would be for 2019 to essentially the same as January, purely on the basis that January was very close to the long term trend.

This table lists the predicted values in °C compared with the 1981-2010 average, and gives the probability of reaching various milestones. So far on the basis of one months data, it seems probable that 2019 will be warmer than 2018, and for surface data, very likely to be one of the 5 warmest years on record. Satellite data is also likely to be in the top 5, but this is less certain due to the strength of 1998 and 2010 in the satellite data. There is a small chance that 2019 will be the warmest year on record, purely due to the natural uncertainty of the coming months, but realistically this seems unlikely to me unless there is a big El Niño in the coming months.

January - Predictions
Dataset Prediction Interval Top 5 Warmer Than 2018 Record Warmest
BEST 0.45 ±0.14 96.6% 72.0% 3.0%
GISS 0.44 ±0.14 97.4% 71.7% 3.8%
HADC 0.42 ±0.15 95.8% 93.8% 14.5%
NOAA 0.44 ±0.14 96.6% 87.7% 13.2%
RSS4 0.50 ±0.16 76.1% 92.7% 5.0%
UAH6 0.32 ±0.18 70.2% 85.0% 1.7%

Finally here are some of the predictions in graph form.

Monday, 11 February 2019

2018 Temperature Roundup

Somewhat belatedly, due to the weirdness of American government and the fact I've had better things to do, here is the final round up of 2018.

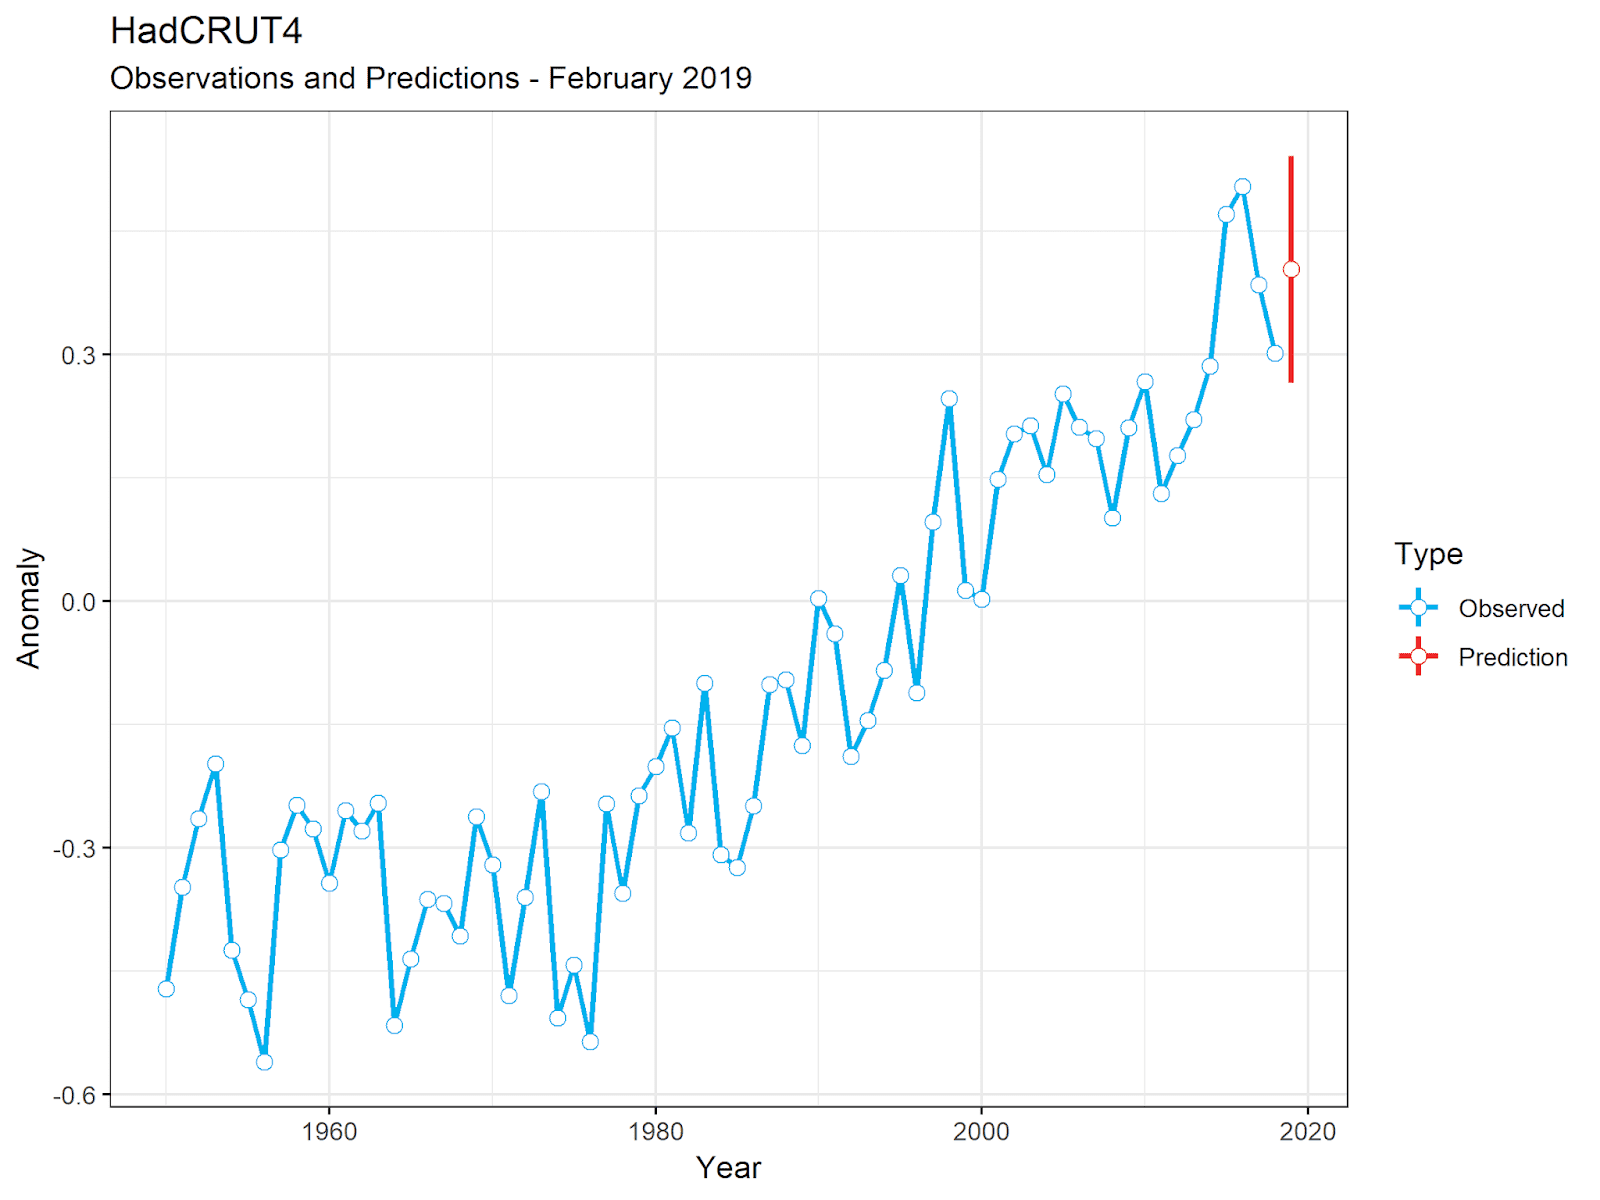
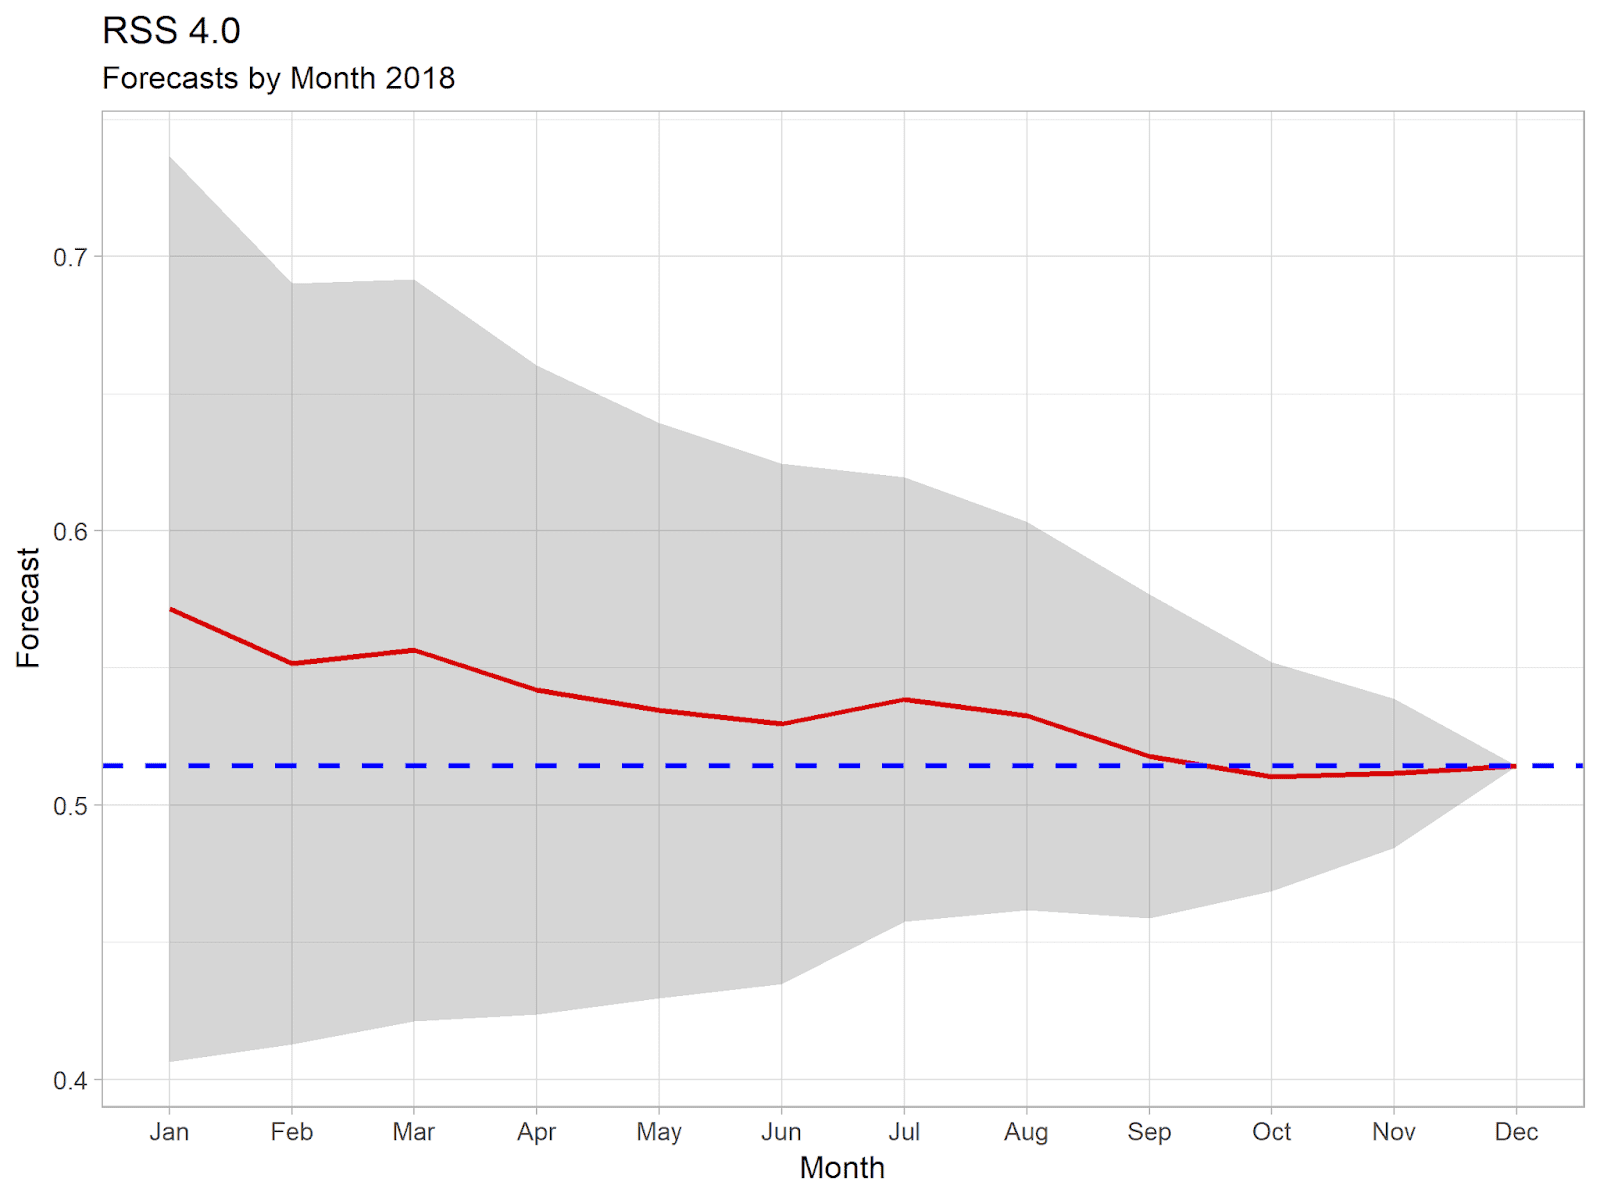
This is going to be very brief, with just the graphs showing annual temperatures for each data set, along with a graph showing how my forecast progressed through the year. The forecast graph shows a red line representing the predicted annual anomaly after each month's data had been released, and a grey area showing the 95% confidence interval in that prediction. The blue dotted line shows the final figure for 2018.

Note, that as always the predictions have been calculated from current data. Actual forecasts made at the time might have been different as the initial release of monthly data is provisional and generally changes as more data is added.

Temperature's in 2018

Both satellite data sets show 2018 as being the 6th warmest. All surface data sets show 2018 as being 4th warmest. The main difference here is that satellite data shows the strong El Niño years of 1998 and 2010 as being much warmer than surface data sets.

UAH and HadCRUT, could be considered to be statistically tied for 6th or 4th place respectivly, in other cases there is little doubt about the rankings. All surface data sets show the last 4 years to have been the 4 warmest on record, and all but BEST show the last 5 years to have been the 5 warmest on record. Satellite data shows the last 4 years to have been 4 of the 6 warmest years on record, with only 1998 and 2010 spoiling the clean run.

More importantly, all data sets continue to show a consistent warming trend since the 70s. For UAH this trend is around 1.3°C / century. For all other sets this is around 1.7 - 1.9°C / century. All data sets show 2018 as being very close, if slightly below, the trend. Of course, none of this will stop the usual claims in some quarters that there has been rapid cooling since 2016.

As for my predictions, I'd have to say that this year they were remarkably accurate even from January, rarely more than a few hundredth of a degree out. I'd like to suggest this shows how amazing my simple prediction algorithm is, but in reality it just reflects the fact that 2018 was a very dull year, with little variation in monthly temperatures and all close to where you'd expect given the trend.

Satellite Data

UAH
RSS

Surface

HadCRUT
GISTEMP
BEST
NOAA

Friday, 1 June 2018

Temperature Update - April 2018, HadCRUT

According to the UK Met Office Hadley Centre data set HadCRUT, the global anomaly for April 2018 was 0.629°C above their 1961-1990 base period. This is slightly higher than the previous month, and makes April the warmest, by anomaly, month of the year so far. It is the 7th warmest April in the HadCRUT record starting in 1850.

April anomalies from the HadCRUT4 data set. Anomalies are in °C compared with the 1961 - 1990 base period.

Sunday, 24 December 2017

Temperature Updates - November 2017 - HadCRUT

A Christmas present from the Met Office and Hadley Centre as they release the November HadCRUT data early.

This shows the anomaly in November to be 0.547°C, compared to the 1961 - 1990 base period. This is slightly cooler than last November, and in contrast to GISTEMP and BEST is only the 10th warmest November on record.

This is much more like the pattern for November in the NOAA data set. The differences between the different data sets possibly is due to the extend different sets cover the Arctic.

The 12 month rolling average for HadCRUT looks like this.

The average anomaly for 2017 so far is 0.685°C, down from 0.699°C up to October. My prediction for 2017 is now 0.681 ± 0.026°C, compared with last months prediction of 0.692 ± 0.041°C.

As can be seen from the graph it's difficult to see HadCRUT finishing anywhere other than 3rd warmest. In fact my statistical model makes this 100% certain.

HadCRUT4
Rank Year Anomaly Probability Change
1 2016 0.8 0.00% -0.00%
2 2015 0.76 0.00% -0.05%
3 2014 0.58 100.00% +0.05%

I'm not going to disagree with that. December could be anywhere from -0.57 to +1.63°C, and 2017 would still finish 3rd.

December Round Up

With all the data sets I follow updated to November we have a pretty clear view of where 2017 will finish. GISTEMP, BEST, and RSS will probably finish 2nd warmest, with only an outside chance of dropping to 3rd. NOAA, HadCRUT, and UAH will probably finish 3rd warmest, with only UAH having a small chance of finishing 4th.

Monday, 18 December 2017

Temperature Update - November 2017 - GISTemp

NASA's released the latest GISTEMP data.

The anomaly for November was 0.87°C compared with the 1951 - 1980 base period. This is down slightly from 0.90°C in October. This is the 3rd warmest November on record. The last three Novembers have been the three warmest Novembers on record.

It is extraordinary how much warmer the last three years have been in November compared with any previous year. The equal 4th warmest Novembers were 2010 and 2013, and they were almost a tenth of a degree cooler than this current month.

The 12 year rolling average continues to cool from the el Niño peak.

The cumulative average for 2017 is virtually unchanged, down to 0.901°C from 0.904°C up to October.

Forecast

My forecast for 2017 is now 0.895 ± 0.025°C, compared with the forecast from October of 0.897 ± 0.04°C.

It is increasingly likely that this will be the 2nd warmest year on record. In any event 2017 will be very close to 2015, two very warm years sandwiching a much warmer year.

GISTEMP
Rank Year Anomaly Probability Change
1 2016 0.99 0.00% -0.00%
2 2015 0.87 97.99% +5.38%
3 2014 0.73 2.01% -5.38%

For 2017 to drop to 3rd place will require December to drop to around 0.53°C. The last time a December was this cool was 2012.

Other Data Sets

I'm not giving detailed monthly updates on BEST and NOAA, but with one month to go here's a brief update on them.

BEST is very similar to GISTEMP. November was also the third warmest on record, and it is also shows 2017 on track to be second warmest, with similar (slightly better) odds to GISTEMP.

NOAA has a somewhat cooler month with November 2017 being identical to 2016 at equal 5th warmest. According to my statistical model NOAA is now 100% certain to finish 3rd warmest, and looking at the graph it is easy to see why.

As with HadCRUT the fact that NOAA is finishing in a different position to GISTEMP and BEST has more to do with how warm 2015 was than with a big drop in 2017.

Wednesday, 20 September 2017

Temperature Update August 2017 - GISS and NOAA

We now have updates from both the GISS and NOAA surface temperature records for August. Both show another warm month. Second warmest August in the GISS record, third warmest for NOAA. There isn't much of an actual difference between the two.

Comparison of August Anomalies between GISS and NOAA.

This has made vary little difference to either the current average, or my predictions for 2017. For GISS the average for 2017 up to August is 0.93 °C, compared with 0.94 °C up to July. The prediction for 2017 is 0.91 ± 0.07°C, unchanged from the prediction in July apart from slightly more confidence.

For NOAA the average for 2017 up to August is 0.88 °C, compared with 0.89 °C up to July. The prediction for 2017 is 0.86 ± 0.07°C, compared with a prediction of 0.87 ± 0.08;deg;C in July.

The differences in predictions for GISS and NOAA are due to rounding to two decimal places. In both cases the predictions dropped by around 0.001 °C.

Annual Observations and Forecast for 2017 for GISS Surface Temperatures, based on data up to August 2017.

The slight narrowing of the prediction intervals has firmed by the probabilities a bit, and it looks increasingly likely that 2017 will be 2nd warmest in the GISS record, and 3rd warmest in NOAA's.

Below are the tables showing the probability, based on data up to August, of each data set finishing at the specified position, and the change from the predictions made based on data from July.

GISS
Rank Year Anomaly Probability Change
1st 2016 0.99 °C 1.2% -1.6%
2nd 2015 0.87 °C 87.9% +4.4%
3rd 2014 0.73 °C 10.9% -2.8%

NOAA
Rank Year Anomaly Probability Change
1st 2016 0.94 °C 1.3% -1.7%
2nd 2015 0.90 °C 13.3% -2.9%
3rd 2014 0.74 °C 85.4% +4.7%
4th 2010 0.70 °C 0.0% -0.1%

Friday, 1 September 2017

Predicting 2017 - July Edition

Introduction

Here are my predictions for 2017, updated for data up to July. First the usual disclaimer, all these predictions are my own, based on simple statistical inference. They are not based on climate models or forecasts. They are just a bit of fun, and a chance for me to mess about with R. See here for the June predictions.

The main headline from July is that nothing much has changed. The predictions for all data sets are the same as they were for June (to the nearest hundredth of a degree). The confidence in these predictions has increased, so the probabilities of the likely positions will have changed.

The follow shows the details for each of the main data sets. For each set there is a description of the expected value for 2017, followed by a graph showing the previous annual anomalies starting in 1979, and the 95% prediction interval for 2017. Finally there is a table listing the current warmest years for the set along with the probability of 2017 finishing at each position, and the change since the June predictions.

All anomalies are compared to the base period used the the providers of each data set, so should not be compared with each other.

The Predictions
UAH 6

The anomaly for UAH 6 up to July is 0.30 °C. The predicted anomaly for 2017 is 0.30 ± 0.07 °C. This would make 2017 the 4th warmest year on record.

Rank Year Anomaly Percent Change
1st 2016 0.51 °C 0.0% +0.0%
2nd 1998 0.48 °C 0.0% +0.0%
3rd 2010 0.33 °C 19.4% -3.3%
4th 2015 0.26 °C 65.2% +9.9%
5th 2002 0.22 °C 14.3% -4.3%
6th 2005 0.20 °C 0.8% -1.2%
7th 2003 0.19 °C 0.2% -0.5%
8th 2014 0.18 °C 0.0% -0.3%
RSS 4

The anomaly for RSS 4 up to July is 0.58 °C. The predicted anomaly for 2017 is 0.57 ± 0.08 °C. This would make 2017 the 3rd warmest year on record.

Rank Year Anomaly Percent Change
1st 2016 0.74 °C 0.0% -0.1%
2nd 1998 0.58 °C 41.7% -0.3%
3rd 2010 0.56 °C 21.2% +3.0%
4th 2015 0.54 °C 18.2% +1.7%
5th 2005 0.42 °C 18.9% -4.2%
6th 2014 0.41 °C 0.0% +0.0%
7th 2003 0.39 °C 0.0% -0.1%
8th 2002 0.38 °C 0.0% +0.0%
GISSTemp

The anomaly for GISSTemp up to July is 0.94 °C. The predicted anomaly for 2017 is 0.91 ± 0.08 °C. This would make 2017 the 2nd warmest year on record.

Rank Year Anomaly Percent Change
1st 2016 1.00 °C 2.3% -1.0%
2nd 2015 0.87 °C 83.8% +3.9%
3rd 2014 0.73 °C 13.9% -2.9%
4th 2010 0.70 °C 0.0% +0.0%
5th 2005 0.67 °C 0.0% +0.0%
6th 2007 0.64 °C 0.0% +0.0%
7th 2013 0.64 °C 0.0% +0.0%
8th 2009 0.63 °C 0.0% +0.0%
NOAA

The anomaly for NOAA up to July is 0.90 °C. The predicted anomaly for 2017 is 0.87 ± 0.08 °C. This would make 2017 the 3rd warmest year on record.

Rank Year Anomaly Percent Change
1st 2016 0.95 °C 2.7% -1.7%
2nd 2015 0.91 °C 15.2% -1.3%
3rd 2014 0.75 °C 82.0% +3.2%
4th 2010 0.70 °C 0.1% -0.2%
5th 2013 0.67 °C 0.0% +0.0%
6th 2005 0.66 °C 0.0% +0.0%
7th 2009 0.64 °C 0.0% +0.0%
8th 1998 0.63 °C 0.0% +0.0%
HadCRUT

The anomaly for HadCRUT up to July is 0.73 °C. The expected anomaly for 2017 is 0.72 ± 0.08 °C. This would make 2017 the 3rd warmest year on record.

Rank Year Anomaly Percent Change
1st 2016 0.77 °C 7.5% -4.8%
2nd 2015 0.76 °C 5.7% -1.0%
3rd 2014 0.58 °C 86.7% +5.9%
4th 2010 0.56 °C 0.1% -0.1%
5th 2005 0.55 °C 0.0% +0.0%
6th 1998 0.54 °C 0.0% +0.0%
7th 2013 0.51 °C 0.0% +0.0%
8th 2003 0.51 °C 0.0% +0.0%
Summary

This bar chart shows the estimated probabilities for each data set.

Conclusion

The two satellite sets are most likely to finish 4th warmest or higher, but with a reasonable chance of finishing 5th. For UAH 6, there's a slim chance it could finish 6th or lower. For RSS 4 there is a reasonable chance of beating 1998 to finish 2nd.

The surface data sets are almost certain to finish at least 3rd warmest. Hadley and NOAA are both very likely to be 3rd, but GISSTemp is most likely to finish 2nd. The differences between the data sets has more to do with the relative position of 2015, than with the temperature for 2017.

What all sets continue to show is that on the basis of the first 7 months, 2017 is very likely to be another very warm year. There is no sign of a return to any sort of pause.

Wednesday, 9 August 2017

2017 - Mid Year Forcasts

As we now have temperatures for the first half of 2017 for all the data sets, I thought I might again try my hand at some simplistic statistical analysis - trying to forecast the final 2017 temperature. Last year I was trying to estimate the probability of a new record being set. This doesn't make much sense this year as there was never going to be a realistic chance of that this year. Therefore this year I'll be putting more emphasis on what the final total will mean for the ongoing warming.

This year, I'm using a slightly different, hopefully improved, model which takes into account the underlying trend as well as the temperatures for the year so far.. Using the same model as last year would be forecasting the satellite data as slightly cooler, by around 0.05 °C, and surface data as almost unchanged.

Will 2017 be a record warm year?

Short answer, no. Or at least I'd be very surprised if it is - and pretty worried. For all the satellite data it is all but certain 2017 won't be warmer than 2016. My model puts the chance as zero to two decimal places.

For surface temperature data the situation is a little more uncertain, as statistically I still give all sets a small chance, but I doubt even that small chance is realistic. GISSTemp is least likely to set a record, with only around a 2.5%, around 1 in 40. Other data sets have slightly more chance, but apart from HadCRUT all are under 7.5%. HadCRUT is the odd one out with a surprisingly high ~12.5%.

The usual caveats about these not being based on any climate models, and could be very different if a new La Niña, El Niño, or nuclear war develops.

The Graphs

Here are some of the forecasts in context. Each graph shows the annual temperature from 1979 to 2016 in blue, with the forecast for 2017 in red. The red circle shows the expected anomaly, whilst the red line shows the 95% prediction interval. That is there should be only a 1 in 20 chance that the actual value will be outside the red line.

Note the anomalies shown are all using the respective base period for each set, and the scales of each graph may not be identical.

UAH 6

I'll start with the UAH 6 satellite data. This is the data that will be used by anyone wanting to believe in a pause as it shows the least warming.

It is most likely UAH 6 will finish 4th warmest, but could be 5th or 3rd. It definitely won't be warmer than either of the strong El Niño years and will more likely than not be cooler than 2010. However, it's still looking like 2017 will be a warm year, and there seems little chance we will see a return to Monckton's Great Pause this year.

RSS 4

RSS has now updates their Lower Troposphere data to the new 4.0 version. This is also likely to show 2017 as 5th - 3rd warmest, but with more likelihood of being at the top of that range.

What both satellite sets suggest is that 1998 will have been far more of an outlier than 2016.

GISSTemp

Moving onto surface data, here's GISSTemp. In this set, 2017 is quite likely to be the second warmest, and almost certain to be at least the 3rd warmest.

HadCRUT

I'll finish with HadCRUT as it shows the most likelihood of setting a new record. There's a curious difference between the last two years here and in the GISS data, and this means that whilst HadCRUT has more chance of finishing as the warmest, it also has more chance of finishing 3rd. It's very unlikely to finish 2nd because the last two years were so close together.

For context here's HadCRUT since 1850>

Conclusion

Regardless of the ranking, it is clear that 2017 is on track, in all data sets, to be another very warm year. Those arguing the pause is real and only temporarily disappeared because of the 2016 El Niño may have to change their minds - though more likely they will just start claiming a pause started just before 2016.

Appendix

Here are the figures for all the predictions. This shows the forecast anomaly for each set in °C along with the upper and lower bounds for the 95% probability. As with the graphs, all anomalies are given using the respective data set's own baseline.

Data SetForecastLowerUpper
UAH 5.60.390.300.49
UAH 6.00.300.210.39
RSS 3.30.400.300.49
RSS 4.00.570.480.67
NOAA0.880.790.96
GISSTemp0.910.820.99
HadCRUT0.720.630.81
BEST0.900.810.99

And here's the data as an anomaly of the 1981 - 2010 base period.

Data SetForecastLowerUpper
UAH 5.60.390.300.49
UAH 6.00.300.210.39
RSS 3.30.300.210.40
RSS 4.00.440.350.54
NOAA0.440.350.53
GISSTemp0.480.390.56
HadCRUT0.430.330.52
BEST0.520.420.61