Thursday, 16 November 2017

Temperature Updates - October 2017, GISS

Here is my analysis of NASA's GISTEMP global temperature data for October 2017. All figures are for the Anomaly compared to the 1951 - 1980 base period.

One important note - all comparisons to previous months data and predictions are based on the current data. There are often minor changes to the data in the months following the first publication as more data is added or corrected. I always recalculate my predictions using the current published data, so it is possible the changes to my predictions will not reflect the exact predictions I made the previous month.

Data

The anomaly in October was 0.90°C, compared to 0.80°C in September. This is the second warmest October, although almost identical to last October's figure of 0.89°C. The last four Octobers have been the four warmest on record.

The rolling 12 month average rose by an insignificant amount, less than 0.001°C.

The average for the year is now 0.911°C, almost unchanged from the average up to September of 0.912°C.

Predictions

The prediction for 2017 is now for a final average of 0.904 ± 0.039°C. This is unchanged apart from greater confidence, from the prediction from September of 0.904 ± 0.054°C.

The probability of GISTEMP having it's second warmest year has increased to over 95%.

Probability of GISTEMP Rankings for 2017 - From Data to October.
Rank Year Anomaly Probability Change
1 2016 0.99 0.00% -0.10%
2 2015 0.87 95.55% +5.94%
3 2014 0.73 4.44% -5.84%

Friday, 3 November 2017

Temperature Update - October 2017, RSS

The October data for RSS 4 has been released. As with UAH it's a record October.

Temperatures

October was 0.80 °C above the base period of 1979 - 1998. This is the warmest October on record, 0.08 °C warmer than the previous record set in 2015. As with UAH the three most recent Octobers have been the three warmest.

The anomaly for October was slightly down on that for September, but the cumulative year-to-date average continues to increase. It is now 0.643 °C, up from 0.625 °C in September.

Predictions

The projection for 2017 is now 0.621 ± 0.043 °C, compared with the forecast based on data up to September of 0.605 ± 0.060 °C.

RSS is looking quite likely to finish as the 2nd warmest year, with only about 3% chance of failing to beat current 2nd place of 1998.

Ranking Probabilities for RSS 4.0 - Based on Data to October
Rank Year Anomaly Probability Change
1 2016 0.74 0.00% -0.00%
2 1998 0.58 96.91% +17.31%
3 2010 0.56 2.55% -9.01%
4 2015 0.54 0.52% -6.58%
5 2005 0.42 0.03% -1.72%

Thursday, 2 November 2017

Temperature Update - October 2017, UAH 6

As always the first of the month's temperature updates is from the UAH Satellite data, reported by Dr Roy Spencer here. As with last month it's a surprisingly warm month.

The anomaly for October is reported as 0.63°C compared with the 1981 - 2010 base period. This makes it the warmest October in the UAH record, beating the previous record set in 2015 by 0.20°C. The three most recent Octobers have been the three warmest.

This means we are now seeing an unexpected uptick in the rolling 12 month average.

The year-to-date average is now 0.371°C, up from 0.342°C in September.

Predictions

My statistical prediction for 2017, with only two months to go, is 0.357 ± 0.043°C, compared with the prediction from September of 0.333 &pm& 0.058°C.

This rise in the predicted value for 2017 has had a dramatic effect on the ranking probabilities. Two months ago the prediction was below 2010, and it seemed most likely UAH would be the 4th warmest. Last month this had changed to a roughly even chance that 2017 would beat 2010 to finish 3rd. Now the odds on 2017 finishing 3rd have shot up, to over 86%. Intuitively this seems to high to me, as the last two months have been so anomalously warm, and one suspects some sort of correction is due, but for what it's worth here is the table showing the probability for each ranking.

Ranking Probabilities for UAH 6.0, Based on Data to October
Rank Year Anomaly Probability Change
1 2016 0.51 0.00% -0.00%
2 1998 0.48 0.00% -0.00%
3 2010 0.33 86.62% +37.44%
4 2015 0.27 13.38% -36.16%
5 2002 0.22 0.01% -1.26%
6 2005 0.2 0.00% -0.01%

Footnote

The fact that satellite data has been increasing whilst surface data has been decreasing, over the last couple of months, has been noted by Dr Spencer and Anthony Watts. Only a day before the latest UAH results were released Watt's Up With That were insisting global temperatures were cooling, based entirely on surface data from HadCRUT.

I've no idea why there is this apparent divergence. It maybe that the lower troposphere is gaining more heat than the surface, or it might be some error. If it is an error I suspect it will more likely be a problem with the satellite data than the surface data. But it is interesting seeing the so called skeptics, suddenly showing some much needed skepticism to the satellite data, and even emphasizing that satellites are not measuring the same thing as the surface data sets.

Thursday, 26 October 2017

Temperature Update HadCRUT - September 2017

HadCRUT 4 posted a temperature anomaly of 0.561 °C for September, compared to the base period of 1961 - 1990. This is the 6th warmest September in the HadCRUT record.

There has been some deviation this month between surface data which have all shown September as cooler than the last few years, and satellite data that has shown a record September. Moreover, the two satellite data sets have both had temperatures increasing for the last two months, whereas surface data has shown temperatures decreasing.

I don't know if this portends anything, or if it is just illustrating the problem of just looking at individual months.

The year-to-date average HadCRUT anomaly is now 0.714°C compared to the August value of 0.733°C.

Predictions

The predicted value for 2017 based on data up to September is 0.706 ± 0.056°C, compared with the value from August of 0.718 ± 0.069°C.

This makes it all but certain that HadCRUT will see 2017 as being the 3rd warmest year on record. The slight possibility that HadCRUT might finish warmer than 2015 to snatch 2nd place has almost vanished - my model only gives it 2% and it will probably be less than that if the ENSO forecast was taken into account. At the same time it is virtually impossible for 2017 to finish below 2014 in 3rd place. (Without going into the figures, it would require the last 3 months of 2017 to be the coldest such period in the last 20 years, and a drop in temperature that would be unprecedented in the entire HadCRUT history for 2017 to end up cooler than 2014. Baring a major catastrophe, which is always possible given the state of the world, 2017 not finishing in 3rd place will make 2017 the most extraordinary year in the climatic record.)

Probabilities of 2017 Ranking for HadCRUT 4
Rank Year Anomaly Probability Change
1 2016 0.8 0.10% -1.08%
2 2015 0.76 2.01% -5.78%
3 2014 0.58 97.89% +6.87%

Tuesday, 24 October 2017

Temperature Update - RSS 4, September 2017

The September data for RSS 4 has finally been updated, and it's another very hot month.

Temperatures

September was 0.84 °C above the base period of 1979 - 1998. This is the warmest September on record, 0.09 °C warmer than the previous record set in September 2016. 2016 was in turn 0.15 °C warmer than the previous record set in 2010.

The average anomaly for the year to date is now 0.623 °C, up from 0.596 °C in August.

Predictions

My statistical projection is now that the final average for 2017 will be 0.603 ± 0.06 °C, compared with the forecast based on data up to August of 0.586 ± 0.071 °C.

The increase in the forecast has made it more likely that RSS 4 will have its second warmest year in 2017, but there is still a reasonable chance that it could drop below 1998 to finish 3rd, and as there are several years all with similar temperatures to 1998 this could drop further down the rankings.

Forecast Rankings for RSS 4.0, based on September Data
Rank Year Anomaly Probability Change
1 2016 0.74 0.00% -0.00%
2 1998 0.58 77.53% +21.50%
3 2010 0.56 14.05% -5.36%
4 2015 0.54 6.77% -9.03%
5 2005 0.42 1.65% -7.11%

It will be interesting to see how much of an impact any La Niña will have on these forecasts.

Tuesday, 17 October 2017

Temperature Updates for September - GISS

No September update from RSS yet, which is unusual as satellite data usually gets updated in the first few days of the month, and the old RSS 3.3 was updated a couple of weeks ago. In the mean time we now have the first of the surface data released for September.

NASA's GISTEMP shows an anomaly of 0.8°C for September 2017 (compared with the base period of 1951 - 1980).

This is down by 0.04°C from August, and is the 4th warmest September in the record. The last 5 Septembers have been the 5 warmest Septembers on record.

The average for the year to date is now 0.909°C, compared to 0.923°C in August.

Forecast

My forecast 2017 is now 0.901 ± 0.054°C, compared with the forecast for data up to August of 0.906 ± 0.069°C.

It continues to look more likely that 2017 will be the 2nd warmest in the GISS record, but 3rd is still a distinct possibility.

GISTEMP
Rank Year Anomaly Probability Change
1 2016 0.99 0.12% -0.97%
2 2015 0.87 88.15% +3.63%
3 2014 0.73 11.73% -2.65%

As always this forecast is based entirely on a simple statistical analysis of past years. In particular it does not take into account the possibility of a La Niña forming in the final months. Given forecasts that there is a reasonable likelyhood (55%-65%) of a La Niña forming soon, the probability of 2017 finishing 3rd warmest are going to be higher than my model suggests.

Friday, 6 October 2017

Temperature Updates - UAH September

The UAH satellite data for September has been published, and it continues the theme temperatures remaining stubbornly warm after last years El Niño. The anomaly for September was 0.54°C, which is the warmest September in the UAH record.

As with all of my temperature update posts, temperatures are given in Celsius, and anomalies are relative to the base period used by each individual data set provider. In the case of UAH 6, the base period is 1981 - 2010.

The fact that this is a record September is interesting, as all warmer months have been during El Niño spikes, which are cooling by this time of the year.

The rolling 12 month average in the above graph makes it clear how different 2016 was to 1998, and just how unusual 1998 was.

Predictions

The average temperature for the year so far is 0.34°C, up from 0.32°C in August. The forecast for 2017 is now 0.333 ± 0.058 °C, compared to last month 0.316 ± 0.064 °C.

As expected there is very little change by this time of the year, and my statistical model is not expecting the average for 2017 to change much over the last 3 months. But the small increase from last month has shifted the probabilities a bit.

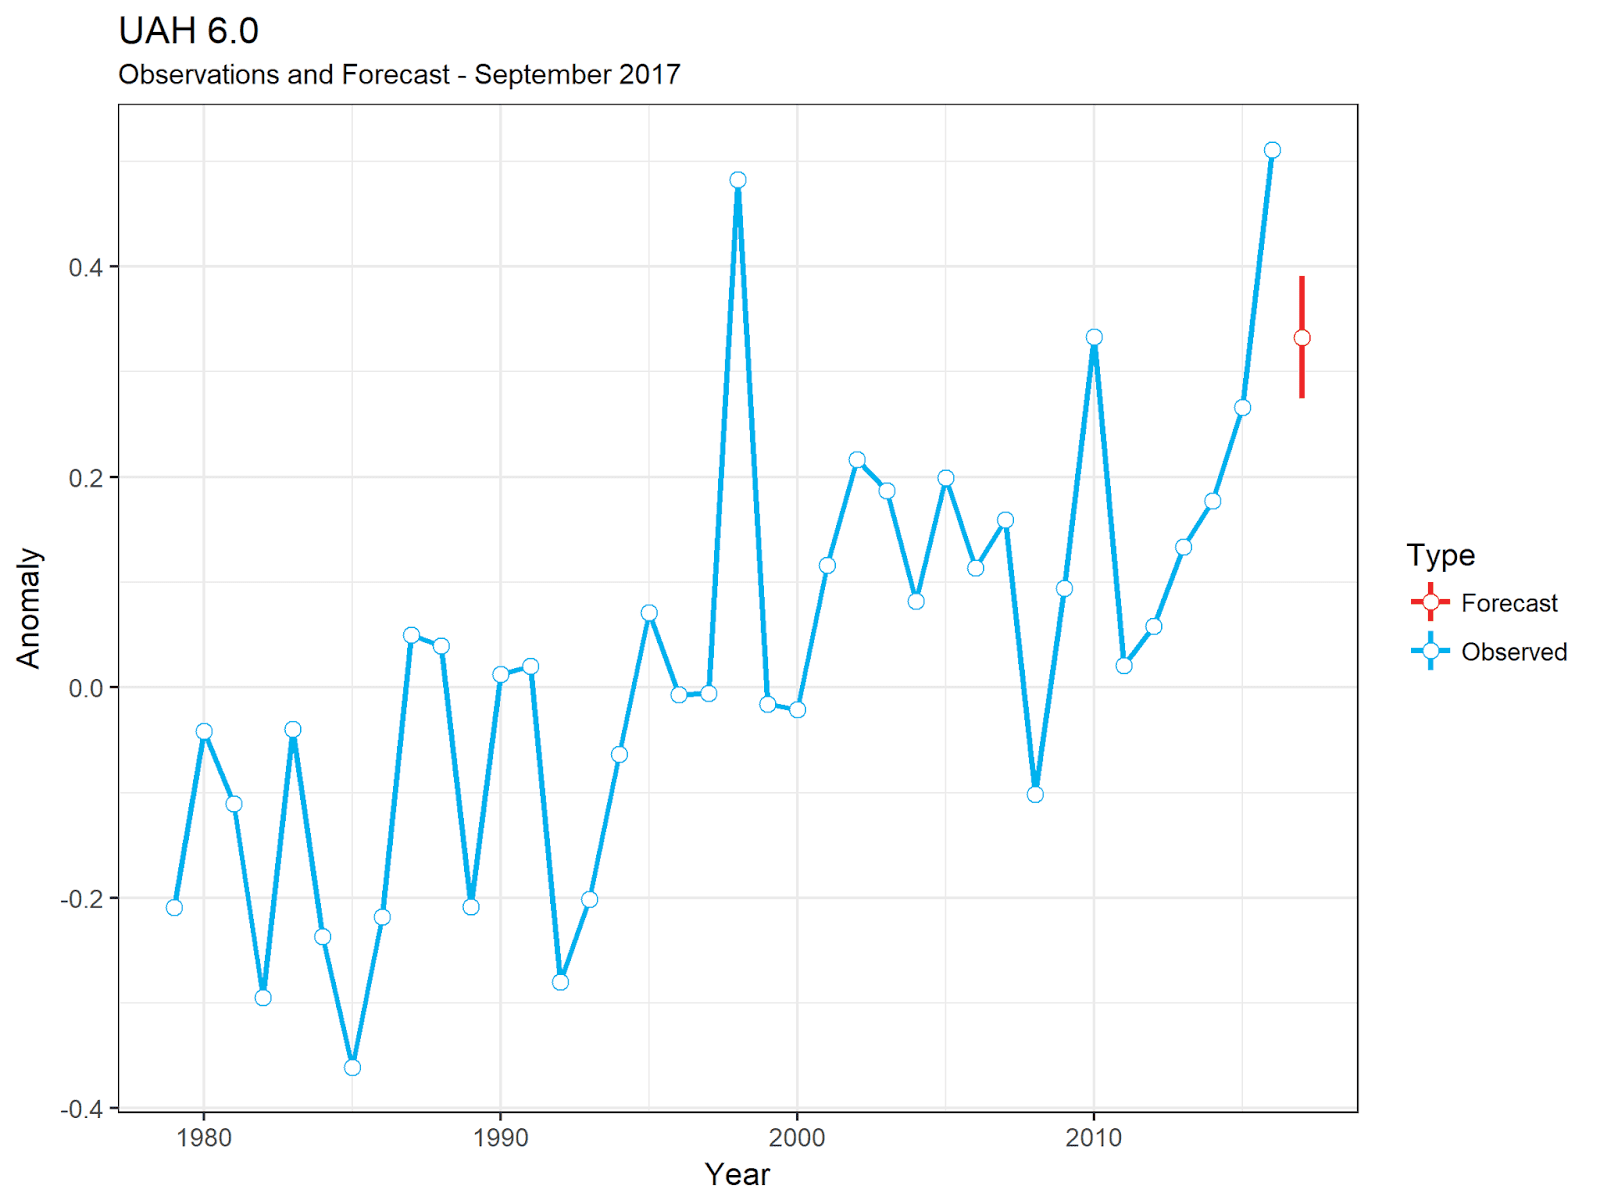
First, here's the usual observation and forecast graph.

The slight increase has now put the forecast almost level with 2010, the third warmest year in the UAH data set. As a result the probability of UAH finishing third has increased somewhat, and it's now roughly evens if UAH will finish in 3rd or 4th place.

UAH 6.0
Rank Year Anomaly Probability Change
1 2016 0.51 0.00% -0.00%
2 1998 0.48 0.00% +0.00%
3 2010 0.33 49.18% +19.49%
4 2015 0.27 49.54% -14.75%
5 2002 0.22 1.26% -4.58%
6 2005 0.2 0.01% -0.12%
7 2003 0.19 0.00% -0.02%