The general uncertainty as to what is really happening makes it easier to cling to lunatic beliefs. Since nothing is ever quite proved or disproved, the most unmistakable fact can be impudently denied. Moreover, although endlessly brooding on power, victory, defeat, revenge, the nationalist is often somewhat uninterested in what happens in the real world. What he wants is to feel that his own unit is getting the better of some other unit, and he can more easily do this by scoring off an adversary than by examining the facts to see whether they support him.
George Orwell - Notes on Nationalism
My Thoughts On Lying
Although the main purpose of this blog was to draw attention to things that are untrue,
I find it oddly difficult to come straight to the point and call these untruths lies.
This is partly because I'm meek and mild and don't want to be sued,
but there are a couple more objections.
One is that it's difficult to determining when someone is actually lying and when they are just wrong.
It can be a fruitless task trying to separate the genuinely deceitful from the credulous or ignorant.
The other is that whilst the act of lying can be a tool of propagandists, accusing others of lying can be an even more effective propaganda trick.
Claiming your opponents of doing what you continuously do is a great way of confusing the issue,
and at its most successful allows your faithful side to disbelieve any evidence used against you, with the added benefit of allowing your followers to feel superior.
Your enemies are such gullible fools believing their own sides propaganda.
You should be prepared to call out obvious lies, but it's more important to explain why the lie is false rather than just shout LIAR, LIAR.
Look for evidence, ask for sources, don't assume that everything that agrees with your world view is true.
Another brief summary of all the main global temperature data sets for February 2019.
As before all anomalies have been recalculated to be relative to the 1981-2010 base period, which may mean that relative changes are different.
February was another month with little change.
All data sets show the average temperature as being somewhat warmer than the base period, with anomalies around one third to a half a degree warmer.
This is similar to the anomaly for January in most cases, but with HadCRUT and NOAA being around 0.1°C cooler.
Compared with last February all data sets show this February being warmer, by around 0.1°C.
February
Dataset
Anomaly
Change from Last Month
Change from Last Year
Trend Since 1979 (per Century)
BEST
0.45
0.02
0.06
1.87
GISS
0.45
0.03
0.08
1.73
HADC
0.33
-0.09
0.14
1.7
NOAA
0.32
-0.11
0.09
1.63
RSS4
0.51
-0.01
0.16
1.98
UAH6
0.36
-0.01
0.16
1.28
February 2019 was between the 3rd and 6th warmest February depending on the data set.
Here a couple of graphs showing temperatures for the month of February.
(Note the scale for GISTEMP is to the 1951-1980 average.)
Predictions
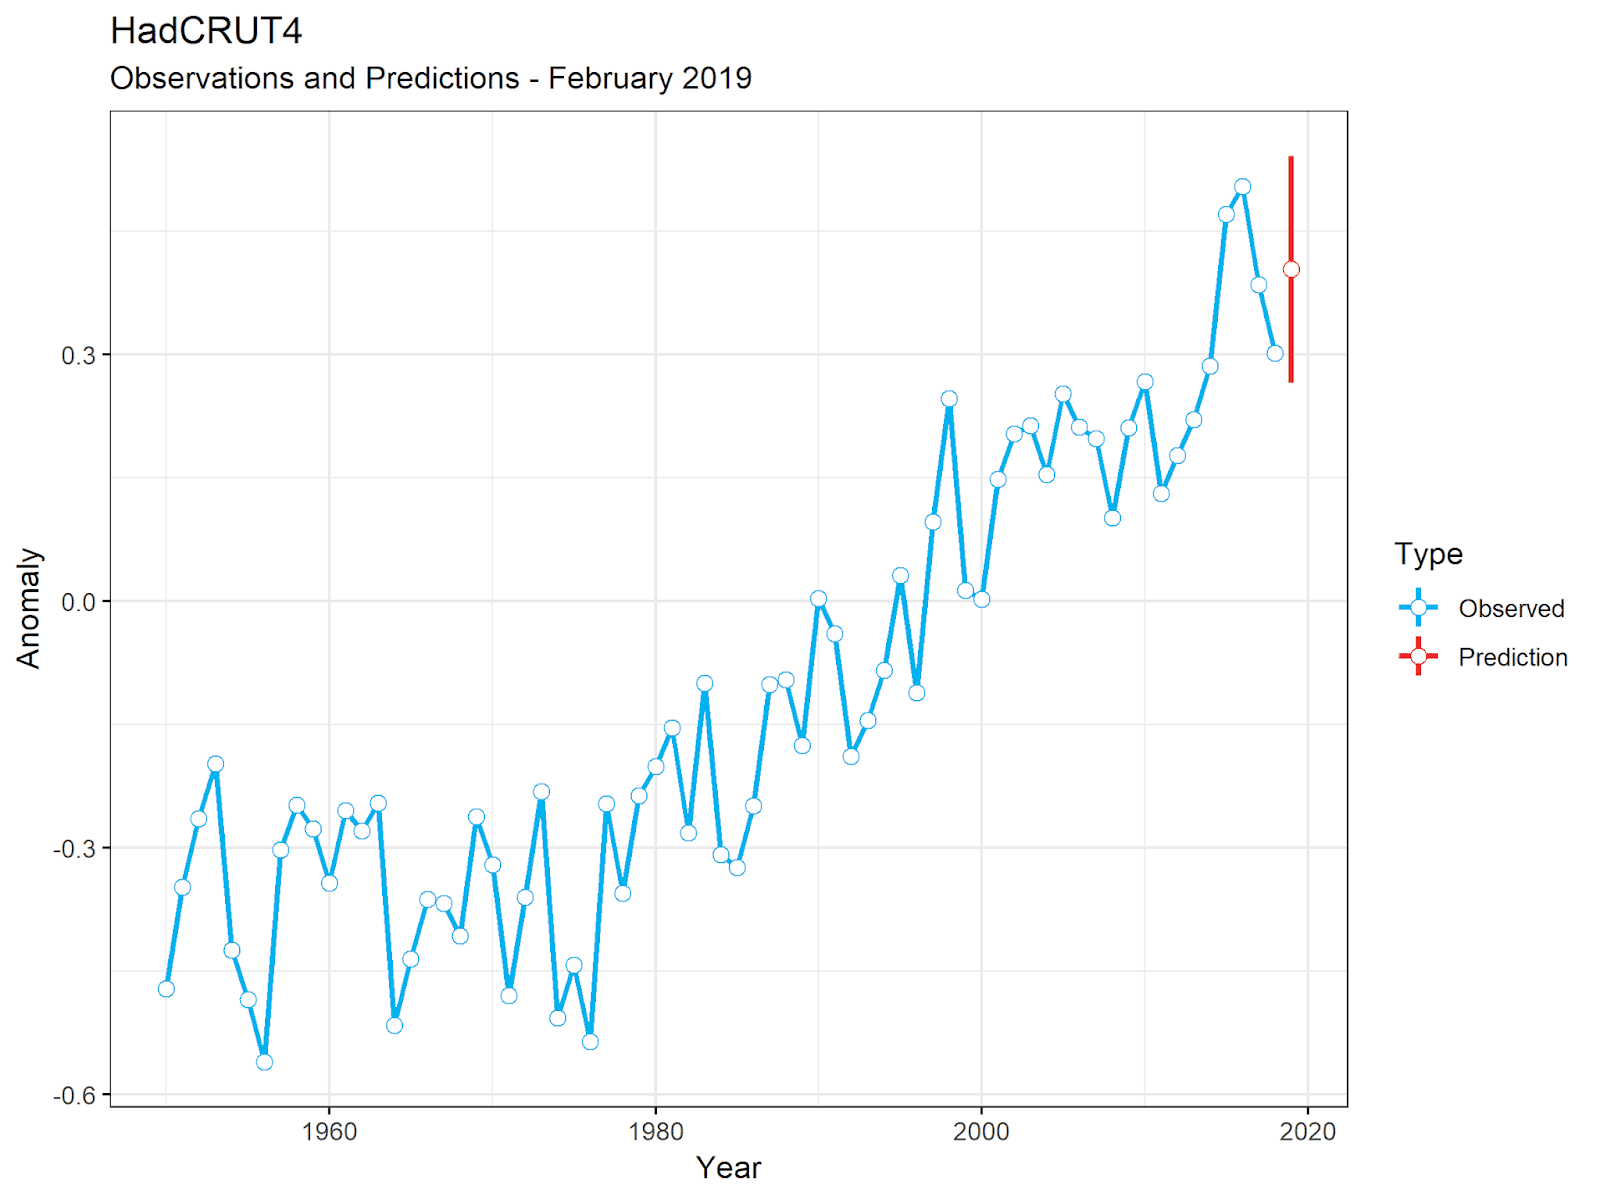
With not much change in the monthly anomalies, and these being close to the warming trend, there hasn't been much change in my predictions.
The mid point prediction is virtually unchanged, at most down a few hundredths of a degree.
All sets are suggesting there is a good chance of 2019 being warmer than 2018, but with only a small chance of being warmest.
The biggest changes from last month is that all sets have reduced the probability of an absolute warmest year, simply because of the slightly narrower prediction intervals.
January - Predictions
Dataset
Prediction
Interval
Top 5
Warmer Than 2018
Record Warmest
BEST
0.44
±0.13
97.0%
71.0%
2.0%
GISS
0.44
±0.13
97.5%
71.1%
2.4%
HADC
0.40
±0.14
95.3%
92.8%
7.5%
NOAA
0.41
±0.12
94.9%
84.1%
5.3%
RSS4
0.50
±0.14
80.2%
95.8%
2.5%
UAH6
0.32
±0.14
76.0%
91.3%
0.4%
A few graphs.
Final Observation
The fact that February was so warm might have came a shock to those who had been a very cold February, especially in the Northern Hemisphere.
Here for example is an article on Watts Up With That, Amid the dimmest Sun since 1978 – a month without sunspots, from the 1st March claiming low sunspot numbers were causing severe winters.
It seems the sun has dimmed more than the usual amount at the end of solar cycle 24, and it could be a factor in the severe winter we are experiencing in many parts of the northern hemisphere.
But of course, cold winters in parts of the USA do not mean cold everywhere.
Some parts of the Northern Hemisphere, such as the UK, were experiencing extremely warm, even record breaking, temperatures during parts of February, and even some parts of the USA, such as Florida, were very hot.
So strong was the conviction that February was going to be cold that when the UAH data was published in WUWT, here, showing Northern Hemisphere temperatures were 0.46°C above average, the comments erupted in accusations about the unreliability of satellite data, some even suggesting fraud and corruption. For example
Sorry, but this presentation does not pass the BS smell test. The northern hemisphere was featured in story after story about cold records, snow records, lake ice jams, etc, and in the southern hemisphere (where I live) producers are struggling with a decent harvest, which does not suggest a normal summer temperature. This all just does not add up to believable. Can somebody familiar with the data sets figure out what is wrong? Otherwise, I’m going with the obvious: BS!
How is this thing supposed to be measuring temperature? This is for the month of Feb, right?
We have had almost the coldest Feb on record…..we’re 61F right now….when we should be high 70’s to low 80’s
…and it says we’re +2 for the month
Something is definitely wrong…..
Que the usual apologist clergy to lie away the discrepancy.
This is why the contrarians here who constantly defend the constant adjustments and lie about temperature are lying liars who deserve no respect and no polite interaction. Denver Colorado was disastrously cold this year, significantly below average. This is pure Orwellian horse crap
It's all a long time (About 4 years) from the time when anyone who questioned the accuracy of satellite data was branded a satellite-denier.
And next months data from UAH is using an adjusted version showing slightly more warming.
One shouldn't bring attention to the current idiocy in charge of the USA, not when my own Government is in the process of bringing the UK to the edge of a precipice.
But this particular tweet from Donald Trump repeats such a common place fallacy that it it's worth going over why it's wrong.
On the 12th of March 2019 the President of the United States of America thought it worth his time to tweet:
Patrick Moore, co-founder of Greenpeace: “The whole climate crisis is not only Fake News, it’s Fake Science. There is no climate crisis, there’s weather and climate all around the world, and in fact carbon dioxide is the main building block of all life.” @foxandfriends Wow!
Ignoring the question of whether Patrick Moore was a co-founder of Greenpeace (he says he was, Greenpeace say he wasn't), or why it matters,
the issue I'm focusing on is the claim that in fact carbon dioxide is the main building block of all life.
I have two main problems with this: 1) it's irrelevant and 2) it's not correct.
Irrelevant
It's irrelevant because it's implying that something either has to be good or bad and cannot be both.
In fact many things are important or essential for life but can also be deadly in other contexts.
Water is essential for life, but even a small amount can drown you.
Iron is essential for life, but you wouldn't want to be hit on the head by an iron bar.
Sunlight is the source of all life, yet that doesn't mean you can ignore the risks of sunburn.
(The people who argue for more CO2 on the grounds that it's the gas of life rarely argue for more solar panels despite solar energy being the source of nearly all energy.)
Incorrect
Now it's a fact that carbon dioxide is essential for the life cycle, but it is not correct to call it the main building block of life.
It's carbon that is the main building block of life, carbon dioxide is just the main delivery system for carbon.
A very simplified description of the role of carbon in the life cycle of plants and animals goes something like this:
Plants absorb carbon dioxide from the air.
Plants use energy from the sun to convert the carbon from CO2 into carbohydrates, releasing oxygen in the process.
The carbon as a store for solar energy.
During the night plants burn some of the carbon for energy, creating carbon dioxide which they release into the atmosphere.
Animals do not use carbon dioxide at all. They either eat plants or other animals, stealing the carbon and energy stored by the plants.
Animals burn carbon for energy by breathing in oxygen and combining it with the stored carbon, producing carbon dioxide as a by product
This carbon dioxide is breathed out as a waste product.
The point of this is that whilst it's often suggested that carbon dioxide is a live giving chemical,
the reality is that for humans and other animals it's at best useless and at worst harmful and even deadly.
It's an irony that long before anyone coined the term gas of life, carbon dioxide was mainly know as a killer gas.
None of this, of course, has anything to do with the problem of CO2 emissions.
The problem with increasing atmospheric CO2 is the danger of increasing the greenhouse effect and so warming the planet.
Nothing to do with whether you view it as beneficial to your health or not.
Belatedly here's a brief summary of all the reports of global temperatures for January 2019.
I'm trying a different format this year, and only intend to release single reports for all the main data sets at the end of each month, when all the data is in.
One major change is that I want to use a consistent base line, so all anomalies are translated into anomalies relative to the years 1981-2010.
I'm not promising I will keep this up all year - it might depend on how much I can automate the work.
Observations
All surface data sets have January at around 0.4 - 0.45°C warmer than the 1981-2010 average, with satellite data not too dissimilar. UAH was a bit below 0.4°C and RSS a bit above 0.5°C.
In all cases this is up around 0.1°C compared with last January.
UAH have 2019 as the 6th warmest January, all other data sets have it as the 4th warmest.
This table summarizes some of the details
January
Dataset
Anomaly
Change from Last Month
Change from Last Year
Trend Since 1979
BEST
0.44
-0.03
0.08
1.88
GISS
0.43
-0.06
0.11
1.71
HADC
0.41
0.08
0.18
1.71
NOAA
0.43
0
0.16
1.64
RSS4
0.52
0.12
0.11
1.98
UAH6
0.37
0.12
0.11
1.28
Hopefully that's not too confusing.
It shows each data set, with the anomaly for January in Celsius compared with the 1981 - 2010 base period.
It also shows the change of that anomaly compared with the previous month (December 2018) and compared with the same month last year (January 2018).
Finally it shows the trend since 1979 in Celsius per century.
1979 is used as a start date for consistency with the satellite data.
Predictions
Too soon to take any predictions seriously, but on the basis of one month the prediction would be for 2019 to essentially the same as January, purely on the basis that January was very close to the long term trend.
This table lists the predicted values in °C compared with the 1981-2010 average, and gives the probability of reaching various milestones.
So far on the basis of one months data, it seems probable that 2019 will be warmer than 2018, and for surface data, very likely to be one of the 5 warmest years on record.
Satellite data is also likely to be in the top 5, but this is less certain due to the strength of 1998 and 2010 in the satellite data.
There is a small chance that 2019 will be the warmest year on record, purely due to the natural uncertainty of the coming months, but realistically this seems unlikely to me unless there is a big El Niño in the coming months.
January - Predictions
Dataset
Prediction
Interval
Top 5
Warmer Than 2018
Record Warmest
BEST
0.45
±0.14
96.6%
72.0%
3.0%
GISS
0.44
±0.14
97.4%
71.7%
3.8%
HADC
0.42
±0.15
95.8%
93.8%
14.5%
NOAA
0.44
±0.14
96.6%
87.7%
13.2%
RSS4
0.50
±0.16
76.1%
92.7%
5.0%
UAH6
0.32
±0.18
70.2%
85.0%
1.7%
Finally here are some of the predictions in graph form.
Somewhat belatedly, due to the weirdness of American government and the fact I've had better
things to do, here is the final round up of 2018.
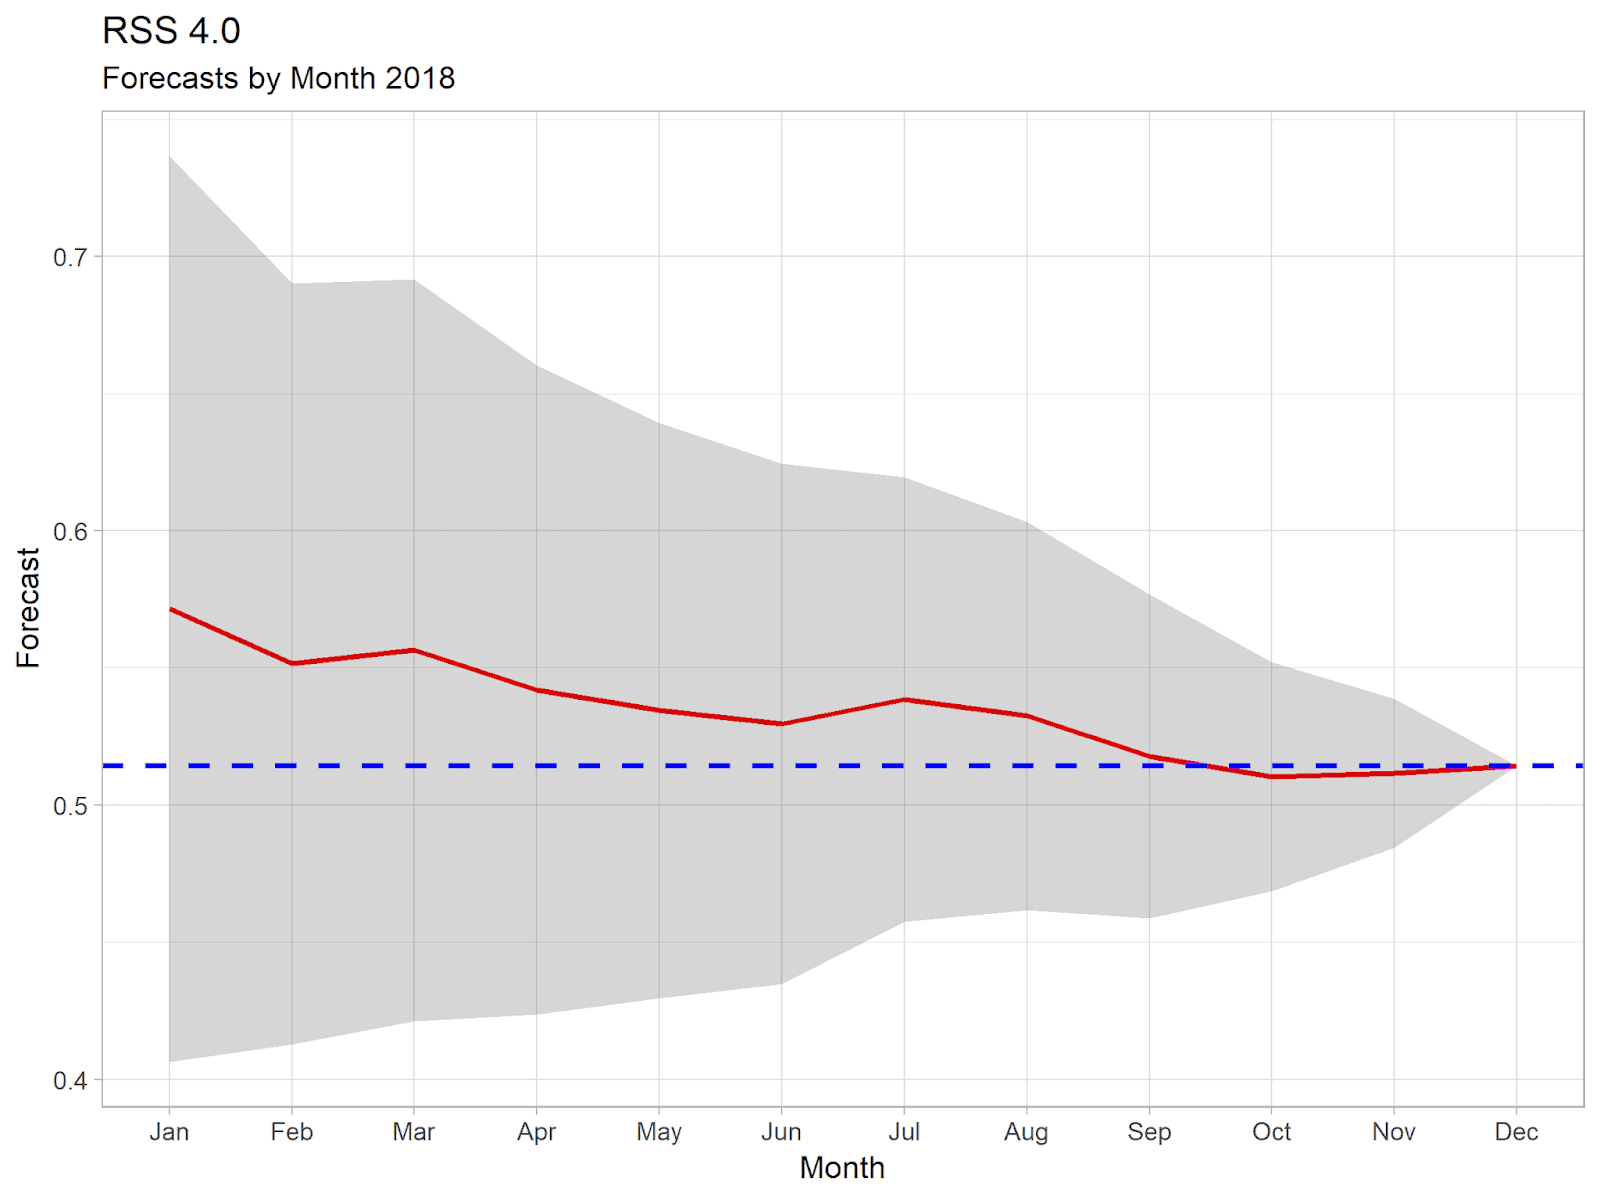
This is going to be very brief, with just the graphs showing annual temperatures for each data set, along with a graph showing how my forecast progressed through the year.
The forecast graph shows a red line representing the predicted annual anomaly after each month's data had been released, and a grey area showing the 95% confidence interval in that prediction.
The blue dotted line shows the final figure for 2018.
Note, that as always the predictions have been calculated from current data.
Actual forecasts made at the time might have been different as the initial release of monthly data is provisional and generally changes as more data is added.
Temperature's in 2018
Both satellite data sets show 2018 as being the 6th warmest.
All surface data sets show 2018 as being 4th warmest.
The main difference here is that satellite data shows the strong El Niño years of 1998 and 2010 as being much warmer than surface data sets.
UAH and HadCRUT, could be considered to be statistically tied for 6th or 4th place respectivly, in other cases there is little doubt about the rankings.
All surface data sets show the last 4 years to have been the 4 warmest on record, and all but BEST show the last 5 years to have been the 5 warmest on record.
Satellite data shows the last 4 years to have been 4 of the 6 warmest years on record, with only 1998 and 2010 spoiling the clean run.
More importantly, all data sets continue to show a consistent warming trend since the 70s.
For UAH this trend is around 1.3°C / century.
For all other sets this is around 1.7 - 1.9°C / century.
All data sets show 2018 as being very close, if slightly below, the trend.
Of course, none of this will stop the usual claims in some quarters that there has been rapid cooling since 2016.
As for my predictions, I'd have to say that this year they were remarkably accurate even from January,
rarely more than a few hundredth of a degree out.
I'd like to suggest this shows how amazing my simple prediction algorithm is, but in reality it just reflects the fact that 2018 was a very dull year, with little variation in monthly temperatures and all close to where you'd expect given the trend.
According to the RSS Satellite data, November was 0.530°C warmer than the 1979 - 1998 average.
This is slightly cooler than last month's anomaly, by less than a hundredth of a degree.
It was the 4th coolest November since satellite records began, with the last 4 Novembers being the 4 warmest on record.
According to the Met Office and Haley Centre global temperature analysis, HadCRUT, October 2018 was 0.687°C above the average for 1961-1990.
This makes October the warmest anomaly of the year, and the 2nd warmest October on record.