Here is a summary of the first half of 2019 for each of my monitored data sets, and my simple statistical predictions for the year.
The headline is that so far all data sets are showing 2019 so far to be hot, one of the warmest on records. My prediction is that 2019 is unlikely to be as warm as the record breaking 2016, but is very likely to be warmer than 2018, and is going to at least be in the top 5 warmest years.
This table summarizes each data set, showing the average anomaly (in °C) for the first 6 months of the year, compared to each data sets specified base period. It shows my simple prediction for the final 2019 value, along with the 95% range of predicted values. Finally it shows the expected ranking, that is the position 2019 will be if the final yearly value was as predicted. This doesn't show how close this would be in some cases.
| Data Set | Average | Base Period | Prediction | Lower | Upper | Rank |
|---|---|---|---|---|---|---|
| UAH | 0.39 | 1981 - 2010 | 0.37 | 0.28 | 0.46 | 4th |
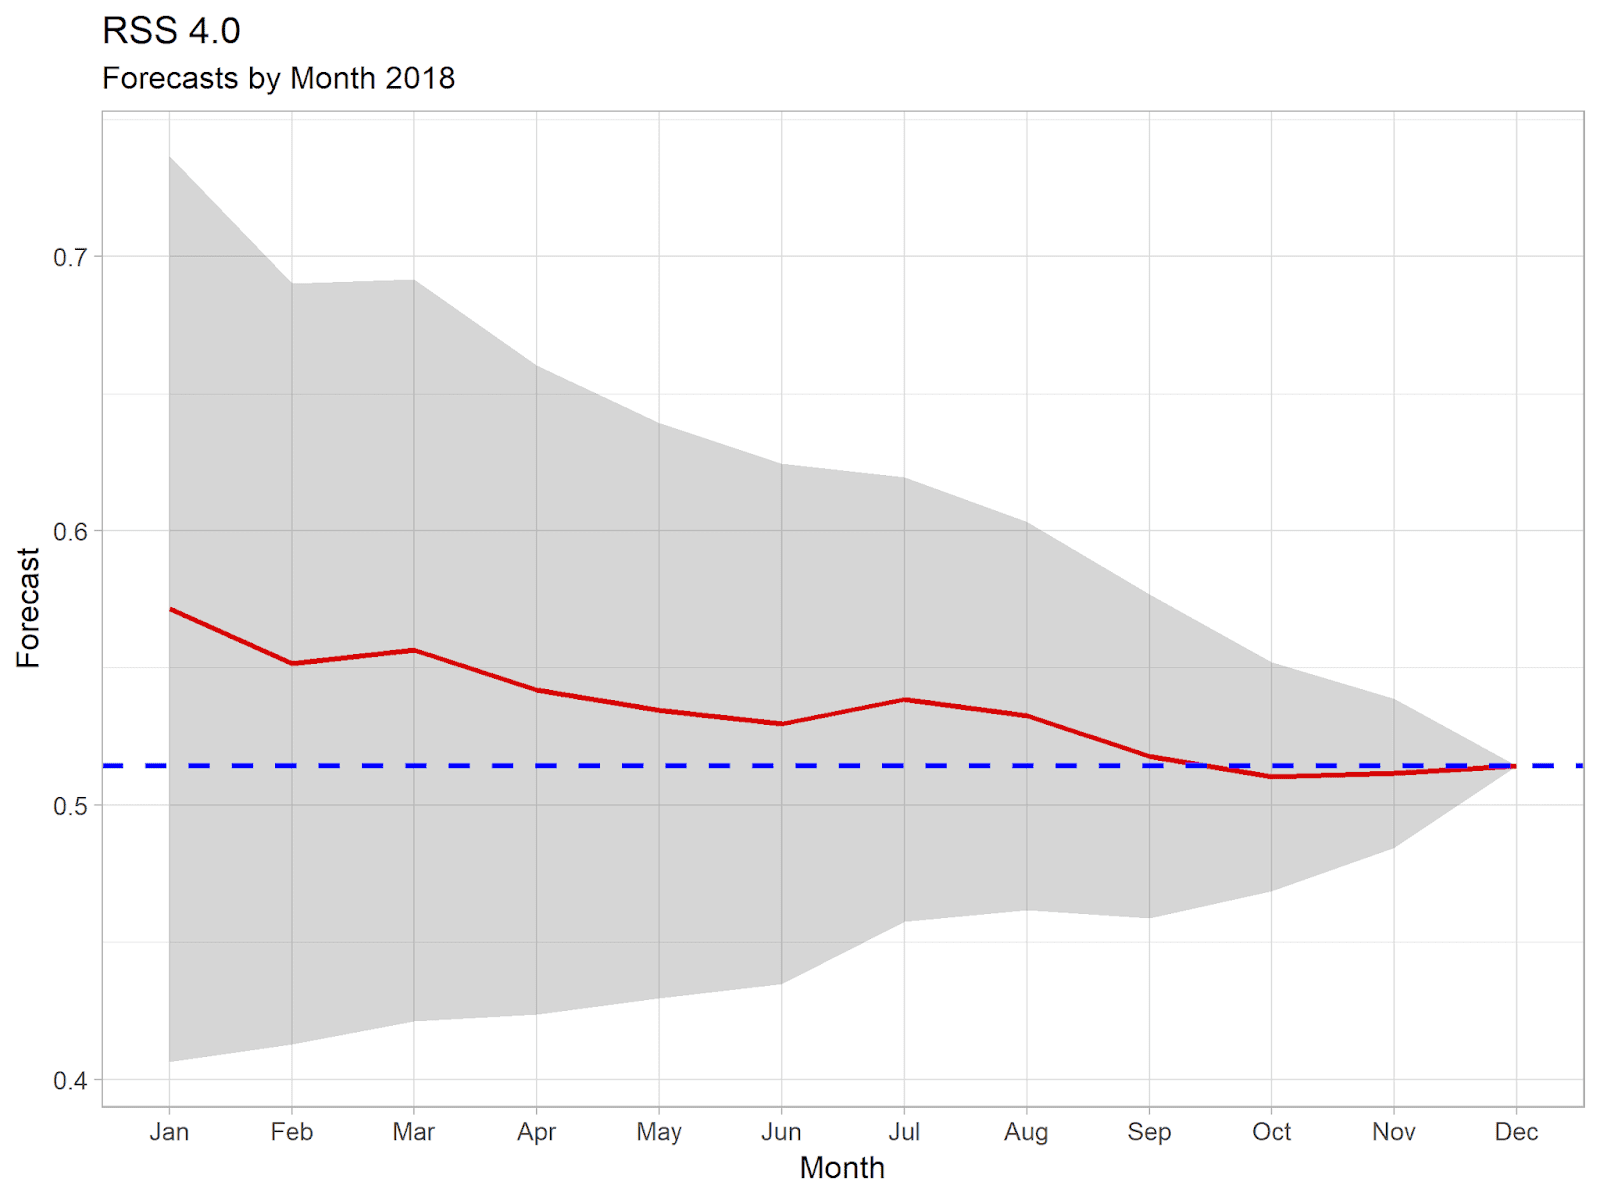
| RSS | 0.71 | 1979 - 1998 | 0.70 | 0.61 | 0.79 | 2nd |
| GISTEMP | 0.98 | 1951 - 1980 | 0.94 | 0.85 | 1.03 | 2nd |
| NOAA | 0.94 | 1901 - 2000 | 0.91 | 0.82 | 1.00 | 3rd |
| BEST | 0.93 | 1951 - 1980 | 0.89 | 0.80 | 0.98 | 2nd |
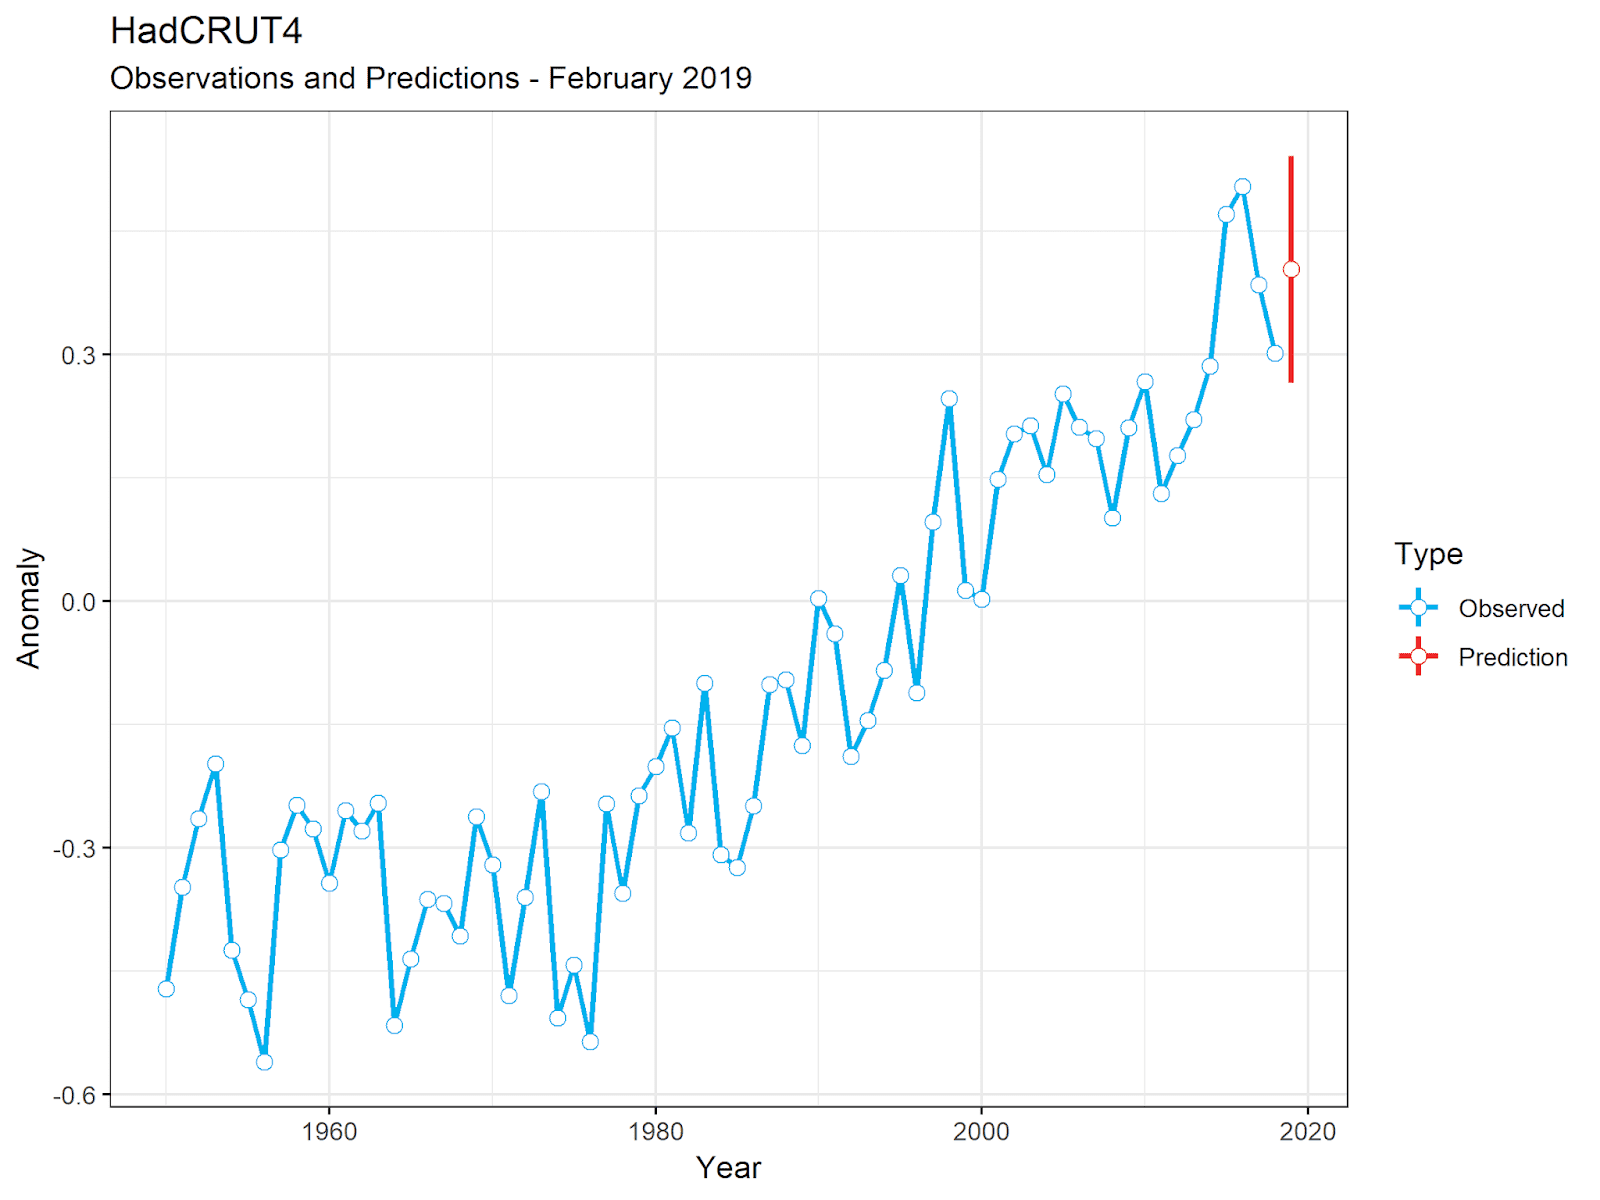
| HadCRUT | 0.73 | 1961 - 1990 | 0.71 | 0.62 | 0.81 | 3rd |
For all data sets except UAH, the range of predicted values suggest 2019 is likely to be between 1st and 4th warmest - though the chances of finishing first is generally pretty low, less than 5%. UAH is likely to be between 3rd and 5th warmest.
The next table shows the probability of each data set beating the various rankings. Note, these are cumulative probabilities, so "3rd" for example is the probability of finishing 3rd or higher. Percentages are given to 1 or 2 decimal places as appropriate. An asterisk indicates the rank of 2018.
| Data Set | Expected Rank | 1st | 2nd | 3rd | 4th | 5th |
|---|---|---|---|---|---|---|
| UAH | 4th | 0.06% | 0.76% | 24.6% | 82.1% | 98.4% |
| RSS | 2nd | 4.4% | 80.5% | 96.4% | 99.0% | 99.3% |
| GISTEMP | 2nd | 4.4% | 65.1% | 82.1% | 97.8% * | 100% |
| NOAA | 3rd | 3.8% | 35.4% | 55.3% | 97.5% * | 99.98% |
| BEST | 2nd | 2.6% | 72.9% | 87.2% | 98.0% * | 99.99% |
| HadCRUT | 3rd | 3.5% | 13.6% | 78.0% | 99.3% * | 99.8% |
Here's the averages and predicted value converted to the same base period (1981 - 2010).
| Data | Average | Prediction |
|---|---|---|
| UAH | 0.39 | 0.37 |
| RSS | 0.57 | 0.56 |
| GISTEMP | 0.53 | 0.52 |
| NOAA | 0.48 | 0.47 |
| BEST | 0.51 | 0.50 |
| HadCRUT | 0.42 | 0.42 |
It's interesting to note that using the later base period has moved the annual predictions closer to the average for the year to date. There's virtually no difference between the prediction and the average, so if true we should expect temperatures for the rest of the year to be only slightly lower than for the first 6 months. I suspect this won't be the case, as ENSO conditions change, and so I wouldn't be surprised if the final temperature is lower than my current predictions.
Some graphs illustrating some of the predictions.


What I find astonishing, and worrying, about all this is not so much the rankings of individual years, but the persistence of the current warm spell. Assuming the predictions for 2019 are not wildly wrong, by the end of the year we will be seeing all surface data sets showing the last 5 years have been the 5 warmest on record, and satellite data showing that the last 5 years have been amongst the 7 warmest on record.
Sources
The above is based on data from the following sources:
- UAH
- The University of Alabama in Huntsville
- RSS
- Remote Sensing Systems
- GISTEMP
- NASA Logo, National Aeronautics and Space Administration National Aeronautics and Space Administration Goddard Institute for Space Studies
- NOAA
- National Oceanic and Atmospheric Administration
- BEST
- Berkeley Earth
- HadCRUT
- Met Office Hadley Centre