HadCRUT 4 posted a temperature anomaly of 0.561 °C for September, compared to the base period of 1961 - 1990.
This is the 6th warmest September in the HadCRUT record.
There has been some deviation this month between surface data which have all shown September as cooler than the last few years, and satellite data that has shown a record September.
Moreover, the two satellite data sets have both had temperatures increasing for the last two months, whereas surface data has shown temperatures decreasing.
I don't know if this portends anything, or if it is just illustrating the problem of just looking at individual months.
The year-to-date average HadCRUT anomaly is now 0.714°C compared to the August value of 0.733°C.
Predictions
The predicted value for 2017 based on data up to September is 0.706 ± 0.056°C, compared with the value from August of 0.718 ± 0.069°C.
This makes it all but certain that HadCRUT will see 2017 as being the 3rd warmest year on record.
The slight possibility that HadCRUT might finish warmer than 2015 to snatch 2nd place has almost vanished - my model only gives it 2% and it will probably be less than that if the ENSO forecast was taken into account.
At the same time it is virtually impossible for 2017 to finish below 2014 in 3rd place.
(Without going into the figures, it would require the last 3 months of 2017 to be the coldest such period in the last 20 years, and a drop in temperature that would be unprecedented in the entire HadCRUT history for 2017 to end up cooler than 2014.
Baring a major catastrophe, which is always possible given the state of the world, 2017 not finishing in 3rd place will make 2017 the most extraordinary year in the climatic record.)
The September data for RSS 4 has finally been updated, and it's another very hot month.
Temperatures
September was 0.84 °C above the base period of 1979 - 1998.
This is the warmest September on record, 0.09 °C warmer than the previous record set in September 2016.
2016 was in turn 0.15 °C warmer than the previous record set in 2010.
The average anomaly for the year to date is now 0.623 °C, up from 0.596 °C in August.
Predictions
My statistical projection is now that the final average for 2017 will be 0.603 ± 0.06 °C, compared with the forecast based on data up to August of 0.586 ± 0.071 °C.
The increase in the forecast has made it more likely that RSS 4 will have its second warmest year in 2017, but there is still a reasonable chance that it could drop below 1998 to finish 3rd, and as there are several years all with similar temperatures to 1998 this could drop further down the rankings.
Forecast Rankings for RSS 4.0, based on September Data
Rank
Year
Anomaly
Probability
Change
1
2016
0.74
0.00%
-0.00%
2
1998
0.58
77.53%
+21.50%
3
2010
0.56
14.05%
-5.36%
4
2015
0.54
6.77%
-9.03%
5
2005
0.42
1.65%
-7.11%
It will be interesting to see how much of an impact any La Niña will have on these forecasts.
No September update from RSS yet, which is unusual as satellite data usually gets updated in the first few days of the month, and the old RSS 3.3 was updated a couple of weeks ago.
In the mean time we now have the first of the surface data released for September.
NASA's GISTEMP shows an anomaly of 0.8°C for September 2017 (compared with the base period of 1951 - 1980).
This is down by 0.04°C from August, and is the 4th warmest September in the record.
The last 5 Septembers have been the 5 warmest Septembers on record.
The average for the year to date is now 0.909°C, compared to 0.923°C in August.
Forecast
My forecast 2017 is now 0.901 ± 0.054°C, compared with the forecast for data up to August of
0.906 ± 0.069°C.
It continues to look more likely that 2017 will be the 2nd warmest in the GISS record, but 3rd is still a distinct possibility.
GISTEMP
Rank
Year
Anomaly
Probability
Change
1
2016
0.99
0.12%
-0.97%
2
2015
0.87
88.15%
+3.63%
3
2014
0.73
11.73%
-2.65%
As always this forecast is based entirely on a simple statistical analysis of past years.
In particular it does not take into account the possibility of a La Niña forming in the final months.
Given forecasts that there is a reasonable likelyhood (55%-65%) of a La Niña forming soon, the probability of 2017 finishing 3rd warmest are going to be higher than my model suggests.
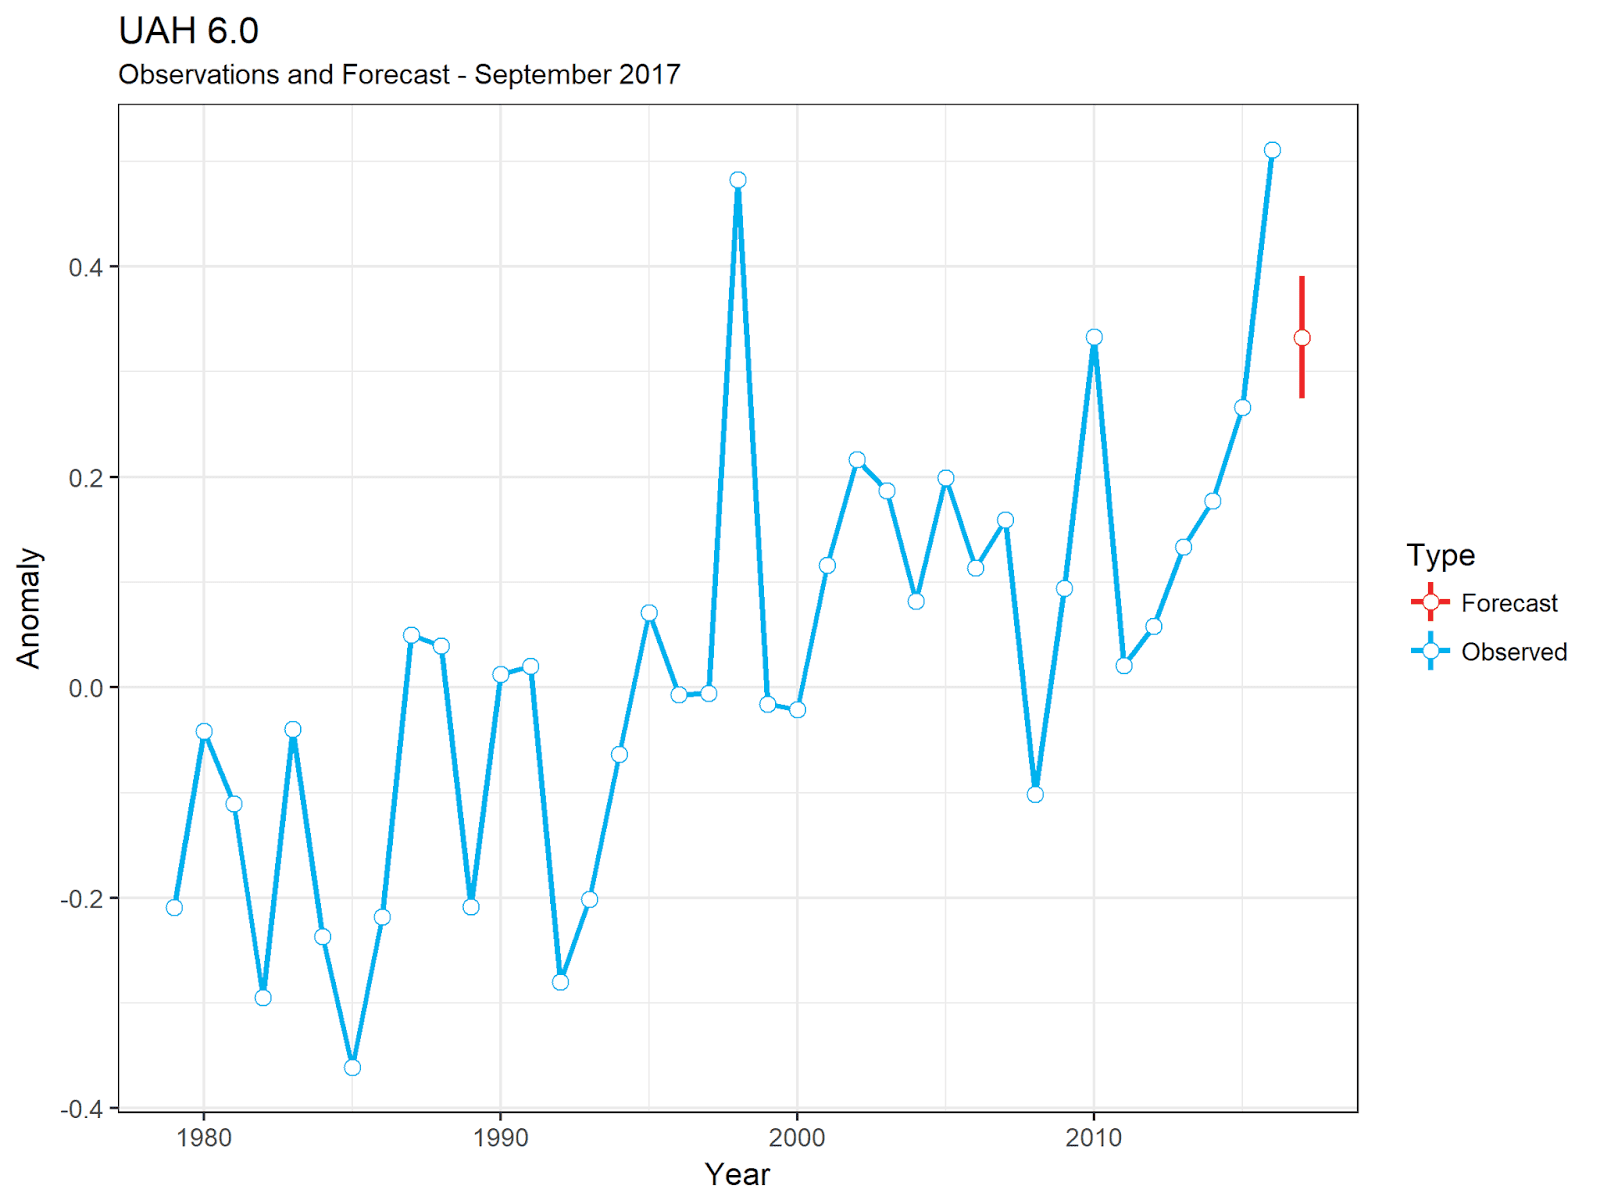
The UAH satellite data for September has been published, and it continues the theme temperatures remaining stubbornly warm after last years El Niño.
The anomaly for September was 0.54°C, which is the warmest September in the UAH record.
As with all of my temperature update posts, temperatures are given in Celsius, and anomalies are relative to the base period used by each individual data set provider.
In the case of UAH 6, the base period is 1981 - 2010.
The fact that this is a record September is interesting, as all warmer months have been during El Niño spikes, which are cooling by this time of the year.
The rolling 12 month average in the above graph makes it clear how different 2016 was to 1998,
and just how unusual 1998 was.
Predictions
The average temperature for the year so far is 0.34°C, up from 0.32°C in August.
The forecast for 2017 is now 0.333 ± 0.058 °C, compared to last month 0.316 ± 0.064 °C.
As expected there is very little change by this time of the year, and my statistical model is not expecting the average for 2017 to change much over the last 3 months.
But the small increase from last month has shifted the probabilities a bit.
First, here's the usual observation and forecast graph.
The slight increase has now put the forecast almost level with 2010, the third warmest year in the UAH data set.
As a result the probability of UAH finishing third has increased somewhat, and it's now roughly evens if UAH will finish in 3rd or 4th place.
This will be a very brief update to finish of the data from August,
for HadCRUT and BEST.
Both posted warm months, in both cases the 3rd warmest August on record.
In fact both show the last 4 Augusts as the top 4 on record.
This has had little effect on the prediction for 2017, both unchanged to the nearest hundredth of a degree.
The forecast for HadCRUT is 0.718 ± 0.069°C, and BEST is 0.872 ± 0.071°C.
The increasing confidence in these forecasts have tightened up the probabilities, with HadCRUT no being more than 90% likely to finish 3rd, and BEST more than 90% likely to finish 2nd.
Hurricanes are sadly in the news again this year, in the Atlantic alone three Category 5 storms causing devastation in the USA and Caribbean.
The extent global warming may have influenced these storms has been much discussed elsewhere, and I don't have anything to add,
but I was interested in what my old bête noire had to say on the matter.
He's made much of his abilities to predict hurricanes in the past, and this year he's been claiming his forecasts are totally brilliant
based on just a 4 day period.
Despite this brilliance, he seems not to have predicted in any detail the major hurricanes affecting the USA and Caribbean; Harvey, Irma and Maria.
His only forecast for Irma was that he was 90% confident that Irma would pass to the east of Florida.
Later putting the fact it hit the West coast of the state down to it unexpectedly hitting Cuba.
Piers Corbyn Destroys the CO2 Con, Again
I might examine the success of the forecasts later - but I'm more interested here in what Corbyn has to say about the extent global warming played in the strength of this hurricane season.
He lays out his most coherent arguments in a section on his WeatherAction web site - headed CO2-Hurricane con destroyed.
This starts of by saying that claiming the extreme hurricanes this year are evidence of CO2 global warming is a lie,
before going of on a typically PC rant about globalist propaganda, fake news, and moronic celeb and political industries.
His main argument here is that not only is he right and everyone else wrong, but all the experts secretly know he's right.
Then we get to the nub of his science, when he says:
The actual observed facts of hurricane dates, numbers and extremes have Solar-Lunar cycles written all over them
and the data TOTALLY NEGATES any connection whatsoever with Man-Made or any CO2.
The evidence for this Solar-Lunar influence on hurricane dates is presented in a series of bullet points.
The first couple insist that there is nothing exceptional about this season, and that the significant lack in the last 12yrs of Tropical storms / hurricanes let alone extreme ones
invalidates any argument about global warming.
Then we get on to his actual evidence for the Solar-Lunar cycle theory of hurricane formation,
which is very week.
All he does is to identify a number of strong hurricane seasons comparable to 2017,
claim a large number of possible cycle lengths,
then look for pairs of years that match any of his cycle lengths.
This is statistical nonsense - it's pure numerology.
He makes no attempt to show that any of these matches are significantly better than chance.
He doesn't care about the lack of extreme years which could have matched any of the patterns,
nor why different extreme years are attributed to any of the many cycles.
There isn't really any need to go into more detail -
until Corbyn supplies some statistical evidence or explains how he thinks these cycles influence the earth's climate there is no reason to suppose his claims are true.
(Corbyn has been claiming the sun and moon influence or cause hurricanes, earthquakes, hail, thundersnow and many other things for decades,
but has still yet to publish any papers, or meaningful evidence to back up any of these claims.)
But when you examine these claims in more detail it becomes obvious just how implausible these claims are.
It's not just that there is no statistical evidence to back up his arguments, but many of them are self contradictory.
Below I'll look at a few of the cycles in more detail.
The Extreme Years
Piers Corbyn identifies a lot of different extreme hurricane seasons using different criteria.
Criteria include the advent of dangerous Hurricanes with lowest central pressure below or equal to 920mb this LATE (20Sep) in season,
11 named storms by Sept 6th, and 2 hurricanes tracked within 75mi Virgin Isles.
The criteria are based on things that have happened in 2017, with the intention of proving that there is nothing special about this season, as well as demonstrating the solar-lunar cycles.
This graph shows the years Corbyn cites for each category.
The years Corbyn selects actually falsify a number of his claims.
He says 2017 isn't exceptions - yet it is the only year that matches all 8 criteria.
He says the severity is evidence of the mini ice-age we are now in - yet only finds one severe hurricane season during the last mini ice-age.
He says there has been a significant lack of hurricanes over the last 12 years - yet identifies two extreme seasons during the last 12 years.
The Solar-Lunar Cycles
Here's Corbyn's list of cycle lengths:
All statements of hurricane extremes appearances confirm the theory of solar-lunar forcing through the appearance of periodicities such as:
~22yrs The magnetic cycle (Hale cycle) of solar activity;
Single, 11yr cycle can also occur;
18 or 19yrs The 18.6 period of full rotation of the plane of the moons orbit, known as the nodal retreat period;
9.3yrs also appears;
~58yrs the Hale - Lunar nodal beat period;
7yrs The repeat period of stratospheric winds in the same season = 3 x 2yr+4mth.
In short any interval between any two hurricane seasons listed as extreme can be considered as confirming Corbyn's theory if it is equal to
7, 18.6, 22 or 58 years (and possibly 9.3 or 11), or any multiple of these numbers.
And the match does not have to be exact - in one case the match can be 4 years out either way and still count as confirmation -
95-33=62, 2004-1950=54, Mean of 62 & 54 is 58 (Solar-lunar beat).
Let's look at some of these different cycles in detail.
The Seven Year Stratospheric Cycle
Corbyn refers to a 7 year repeat period of stratospheric winds in the same season.
This is based on the Quasi-biennial oscillation, or QBO, although Piers doesn't mention it by name.
The QBO is an oscillation in the winds in the stratosphere around the equator, in which the winds periodically switch directions.
The period is roughly 28 months - and Corbyn derives a 7 year cycle form this by noting that 3 cycles of 28 months equals 7 years;
hence every 7 years the QBO is in the same phase at the same time of year.
The first problem with this is that the QBO is not associated with any solar or luna cycle,
so if the 7 year cycle is true it undermines Corbyn's claim that all hurricane activity confirms the theory of solar-luna forcings.
The second problem is that the QBO is only roughly 28 months in length.
Corbyn is assuming that every seven years exactly the same conditions will apply, but this simply isn't true.
This graph illustrates the problem.
It shows the monthly QBO index, with a red dot showing the value in August for every seven years from 1961 to 2017.
The QBO is not at the same point at the same season every 7 years.
For example, in his list of seasons with multiple Category 5 hurricane, he includes 1961 and 2017, and says:
2017-1961=56 = 8x7 (strat) and the nearest multiple of 7 to 58 (solar-lunar beat).
Now compare the first and last red dot in the above graph showing the phase of the QBO in 1961 and 2017.
One is positive the other negative, which means the winds weren't even going in the same direction in the two years.
Moreover, this 7 year cycle isn't kept consistently throughout Corbyn's examples.
Under the category advent of dangerous Hurricanes with lowest central pressure below or equal to 920mb this LATE,
he claims that 1998 and 2005 where both caused by the stratospheric cycle, yet 2005 was 12 years before 2017, which he's also claiming was caused by the same cycle.
The 22 year Hale Cycle
There is a well known solar cycle of roughly 11 years, during which the sun goes from low activity to high activity and back again.
It is possible this influences the climate in various ways.
Corbyn prefers to count alternative cycles as being important, as the sun's magnetic field reverses each cycle.
This 22 year cycle is called the Hale cycle.
Again there's a problem here as the 22 year cycle is only approximate.
Corbyn for instance claims a 147 year period between two pairs of years as confirming the Hale cycle, as 147 is a multiple of 21.
Corbyn identifies all these years as being caused by the 22 year Hale cycle -
The 22 years between 1995 and 2017, the 44 year gap between 1961 and 2005, and the 147 years between 1852 and 1999.
Here's what these years look like on a graph of sun spot numbers.
The graph shows the ~11 year solar cycle - each Hale cycle consists of each pair of solar cycles.
4 of the years Corbyn cites are in odd cycles, 2 (including 2017) are in even cycles.
One of the sample occurs near the peak of the solar cycle.
Some appear at the mid point between solar maximum and minimum, and a couple appear close to the solar minimum.
Corbyn's evidence requires ignoring the actual solar cycle, and only counting years between pairs of years.
It isn't even clear if Corbyn believes strong hurricane seasons should be more likely to occur at times of peak solar activity,
or at solar minimums.
The ~58 Year Solar Lunar Beat Cycle
Aside from the Hale Cycle, Corbyn also believes a lunar orbit cycle of 18.6 years has an effect.
He combines the ~22 and 18.6 year cycle to get a grand cycle of ~58 years, which he seems to consider the most important cycle.
I have no idea how he does this as neither 18.6 or 22 years will go into 58 years.
Every 58 years both the sun and moon will be at different points in their cycles.
Maybe Corbyn has some really clever explanation for how the 58 year cycle works, but so he has yet to explain it.
Moreover, the fact that this cycle is only approximately 58 years and can sometimes be up to 4 years out makes it difficult to square with the regular 18.6 year luna cycle.
What it does mean is that you fit a large range of possible years to it.
Corbyn identifies 10 hurricane seasons as being caused by this ~58 year cycle.
Here's an abstract graph showing a hypothetical 58 year cycle, culminating in a peak in 2017,
along with all the years identified by Corbyn.
There's no pattern here.
Some years are at the bottom of the cycle, some at the top, and some only half way up or down.
Conclusion
Piers Corbyn produces vague imaginary cycles which he says with no physical reason can all be attributed to outer space,
then not only fails to provide evidence that strong hurricane seasons are caused by these cycles, but produces evidence that falsifies that claim.
The really sad part of all this is that it is quite reasonable that there are cycles in weather.
The solar cycle is believed to have an effect on climate, but also ones with no obvious conection with solar influences,
such as the AMO - suspiciously similar to Corbyn's ~58 year cycle.
The problem is that Corbyn's infantile obsession with counting years, his instances that everything has to come from space,
and above all his insistence that all of these cycles somehow disprove the greenhouse effect, mean that he's unlikely to ever make any sensible contribution to science.