Somewhat belatedly, due to the weirdness of American government and the fact I've had better things to do, here is the final round up of 2018.
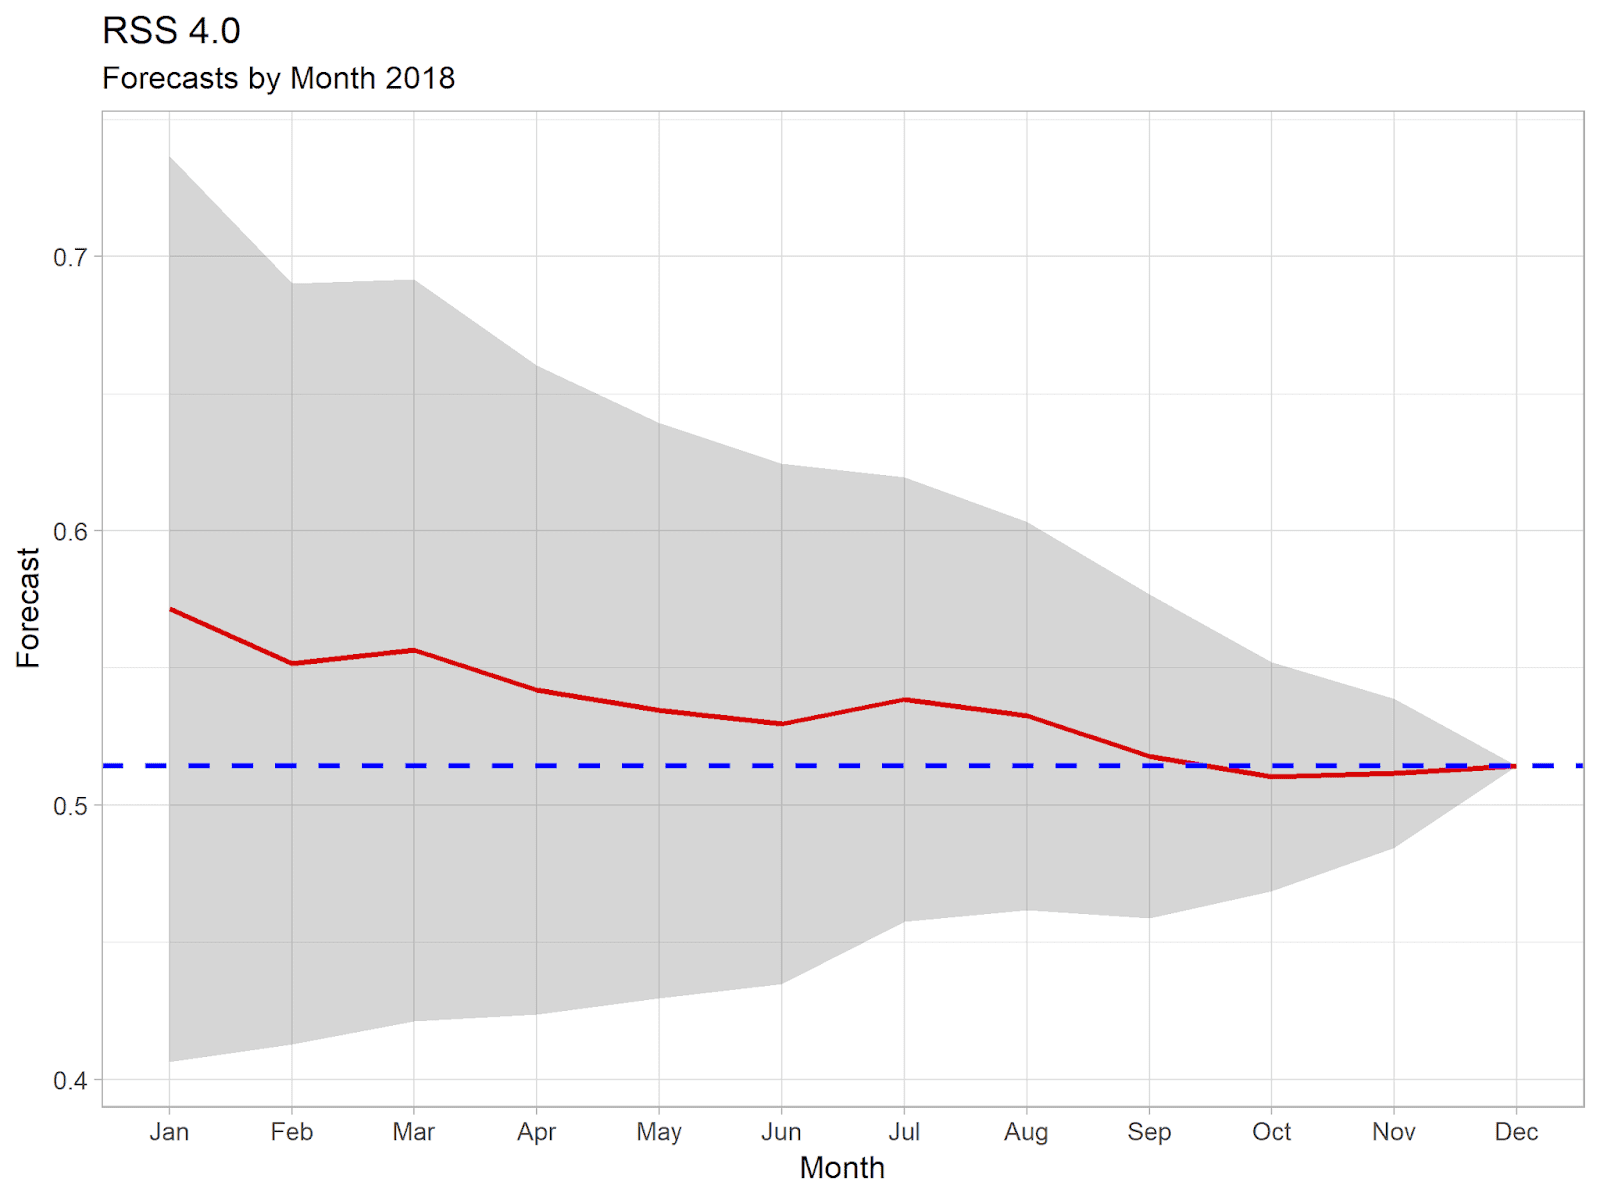
This is going to be very brief, with just the graphs showing annual temperatures for each data set, along with a graph showing how my forecast progressed through the year. The forecast graph shows a red line representing the predicted annual anomaly after each month's data had been released, and a grey area showing the 95% confidence interval in that prediction. The blue dotted line shows the final figure for 2018.
Note, that as always the predictions have been calculated from current data. Actual forecasts made at the time might have been different as the initial release of monthly data is provisional and generally changes as more data is added.
Temperature's in 2018
Both satellite data sets show 2018 as being the 6th warmest. All surface data sets show 2018 as being 4th warmest. The main difference here is that satellite data shows the strong El Niño years of 1998 and 2010 as being much warmer than surface data sets.
UAH and HadCRUT, could be considered to be statistically tied for 6th or 4th place respectivly, in other cases there is little doubt about the rankings. All surface data sets show the last 4 years to have been the 4 warmest on record, and all but BEST show the last 5 years to have been the 5 warmest on record. Satellite data shows the last 4 years to have been 4 of the 6 warmest years on record, with only 1998 and 2010 spoiling the clean run.
More importantly, all data sets continue to show a consistent warming trend since the 70s. For UAH this trend is around 1.3°C / century. For all other sets this is around 1.7 - 1.9°C / century. All data sets show 2018 as being very close, if slightly below, the trend. Of course, none of this will stop the usual claims in some quarters that there has been rapid cooling since 2016.
As for my predictions, I'd have to say that this year they were remarkably accurate even from January, rarely more than a few hundredth of a degree out. I'd like to suggest this shows how amazing my simple prediction algorithm is, but in reality it just reflects the fact that 2018 was a very dull year, with little variation in monthly temperatures and all close to where you'd expect given the trend.
Satellite Data
UAH


RSS

Surface
HadCRUT


GISTEMP


BEST


NOAA


No comments:
Post a Comment