In this post I'll be looking at the two main satellite global temperature sets for May 2018.
Temperatures
The University of Alabama in Huntsville (UAH), has the lower troposphere at 0.18°C warmer than the 1981 - 2010 base period.
Remote Sensing Systems (RSS) has the lower troposphere at 0.41°C warmer than their 1979 - 1998 base period. If RSS used the same base period as UAH, this would mean RSS would have an anomaly of 0.30°C.
Both data sets show a continuing fall in anomalies, with May being the coolest seasonally adjusted month of the year. UAH has 2018 as the 10th warmest May in its 40 year history.

RSS had the 7th warmest May.
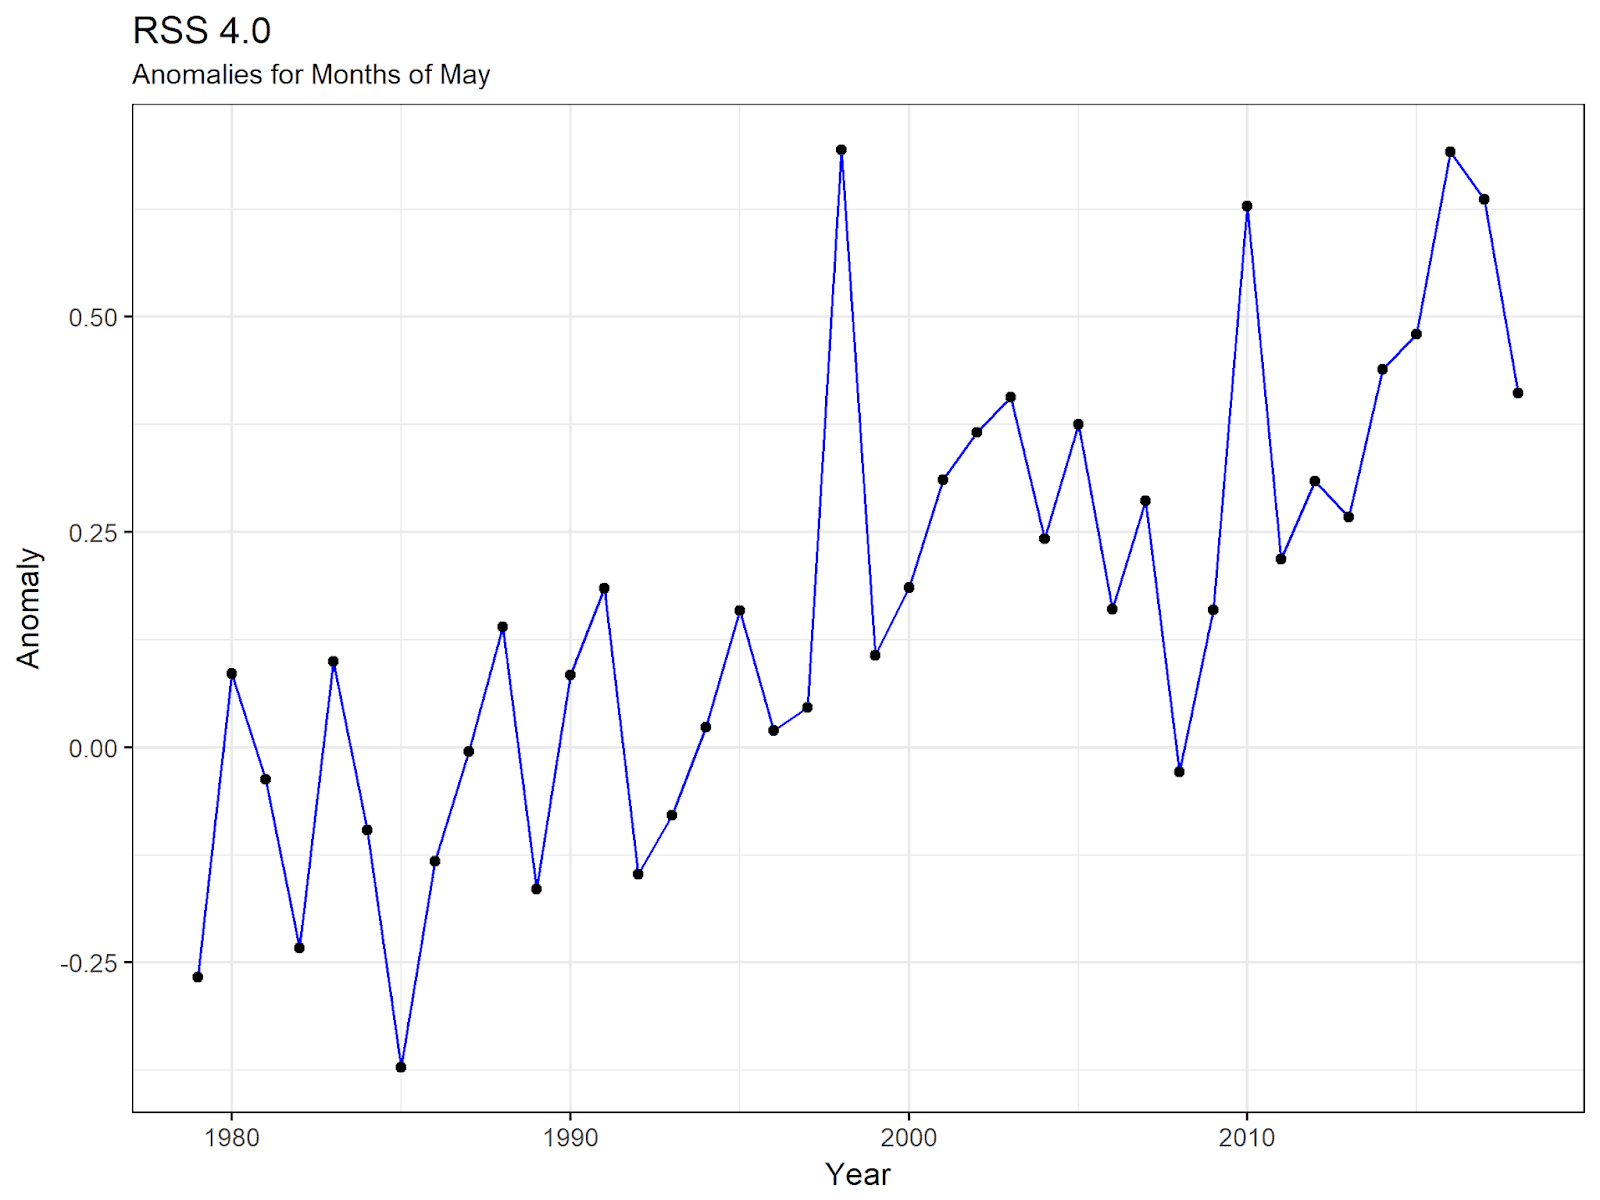
Both data sets show May as being more noticeably below the trend line, but not in any way unusually so.


The trend for both data sets is somewhat different, with UAH warming at the rate of 1.28°C / century, and RSS at the rate of 1.92°C / century. All surface data sets fall between these two extremes over the same period, though generally a lot closer to RSS than UAH.
Predictions
The statistical prediction for each data set takes into account both the average anomaly for the year so far and the underlying trend. For UAH the prediction based on data up to May is for 2018 to have an average anomaly of 0.242 ± 0.103°C, compared to the prediction based on data up to April of 0.246 ± 0.117°C. This compares with the current average for the year of 0.22°C.

For RSS the current prediction is 0.520 ± 1.05°C, compared with last month's prediction of 0.527 ± 0.118°C. This compares with a current average of 0.487°C.

Predictions for Rankings
UAH has the most uncertainty of all the data sets, mostly because of it's slower rate of warming. 5th or 6th (~66%), with little chance of finishing above 5th, but with a reasonable chance (~30%) of finishing below 6th, possibly as low as 12th.
For RSS there is now almost a 70% likelihood of finishing 6th, with only a small chance (~5%) of finishing below 6th, but with a reasonable (~25%) of being higher than 6th, possibly as high as 3rd.
Comparing these probabilities with those for surface data it's worth noting the role that the two strong El Niño years play in the satellite data. 1998 and 2010 are still among the warmest years in satellite history, but in surface data are relatively cooler. Satellite data is tending towards 2018 being 6th or so warmest, whilst surface data is likely to be around 4th warmest, but in terms of recent years both are looking very similar.
Tables
| Rank | Year | Anomaly | Probability | Cumulative |
|---|---|---|---|---|
| 1 | 2016 | 0.51 | 0.00% | 0.00% |
| 2 | 1998 | 0.48 | 0.00% | 0.00% |
| 3 | 2017 | 0.38 | 0.61% | 0.61% |
| 4 | 2010 | 0.34 | 2.90% | 3.50% |
| 5 | 2015 | 0.27 | 26.94% | 30.45% |
| 6 | 2002 | 0.22 | 38.73% | 69.18% |
| 7 | 2005 | 0.2 | 10.81% | 79.99% |
| 8 | 2003 | 0.19 | 6.05% | 86.04% |
| 9 | 2014 | 0.18 | 2.64% | 88.67% |
| 10 | 2007 | 0.16 | 5.87% | 94.54% |
| 11 | 2013 | 0.14 | 3.18% | 97.72% |
| 12 | 2001 | 0.12 | 1.42% | 99.14% |
| Below 12 | N/A | N/A | 0.86% | 100% |
| Rank | Year | Anomaly | Probability | Cumulative |
|---|---|---|---|---|
| 1 | 2016 | 0.75 | 0.00% | 0.00% |
| 2 | 2017 | 0.64 | 1.36% | 1.36% |
| 3 | 2010 | 0.58 | 10.33% | 11.69% |
| 4 | 1998 | 0.58 | 0.73% | 12.42% |
| 5 | 2015 | 0.56 | 12.44% | 24.86% |
| 6 | 2005 | 0.44 | 69.55% | 94.41% |
| 7 | 2014 | 0.43 | 1.03% | 95.44% |
| 8 | 2003 | 0.39 | 3.71% | 99.16% |
| 9 | 2002 | 0.38 | 0.23% | 99.38% |
| 10 | 2013 | 0.38 | 0.18% | 99.56% |
| Below 10 | N/A | N/A | 0.44% | 100% |
No comments:
Post a Comment