The UAH satellite data for September has been published, and it continues the theme temperatures remaining stubbornly warm after last years El Niño. The anomaly for September was 0.54°C, which is the warmest September in the UAH record.

As with all of my temperature update posts, temperatures are given in Celsius, and anomalies are relative to the base period used by each individual data set provider. In the case of UAH 6, the base period is 1981 - 2010.
The fact that this is a record September is interesting, as all warmer months have been during El Niño spikes, which are cooling by this time of the year.

The rolling 12 month average in the above graph makes it clear how different 2016 was to 1998, and just how unusual 1998 was.
Predictions
The average temperature for the year so far is 0.34°C, up from 0.32°C in August. The forecast for 2017 is now 0.333 ± 0.058 °C, compared to last month 0.316 ± 0.064 °C.
As expected there is very little change by this time of the year, and my statistical model is not expecting the average for 2017 to change much over the last 3 months. But the small increase from last month has shifted the probabilities a bit.
First, here's the usual observation and forecast graph.
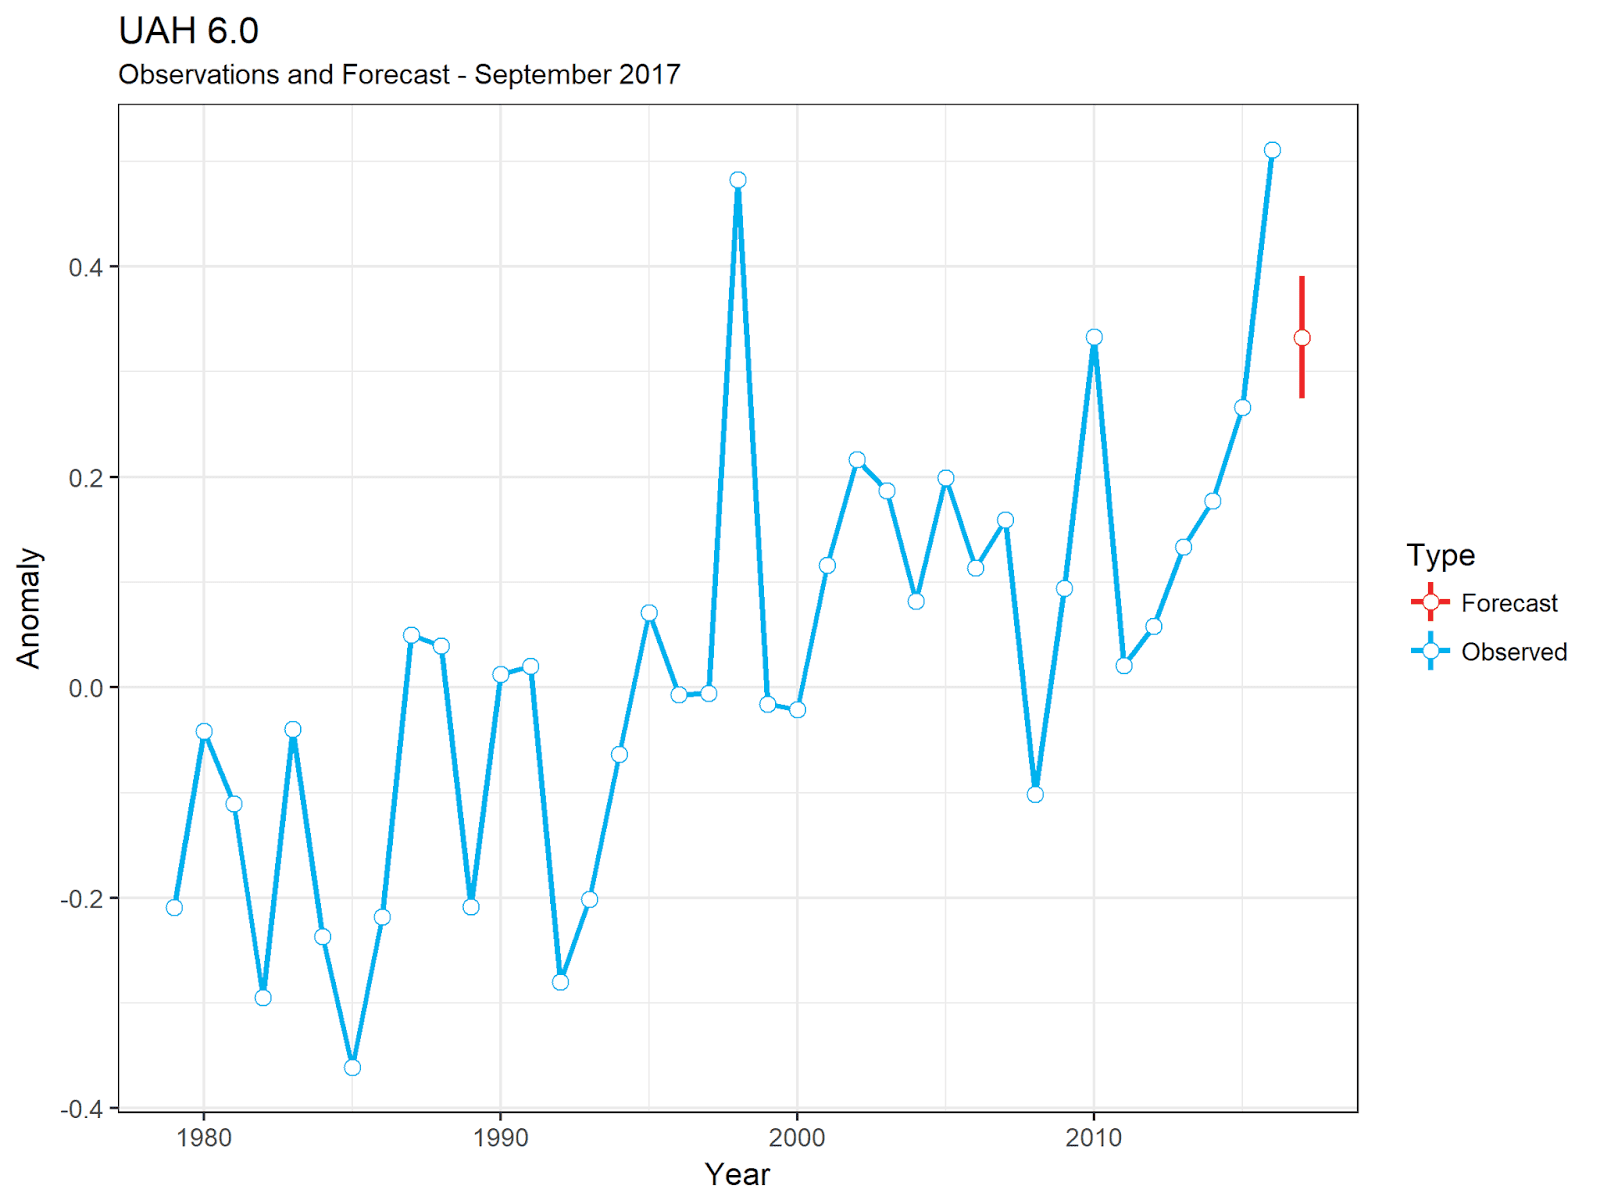
The slight increase has now put the forecast almost level with 2010, the third warmest year in the UAH data set. As a result the probability of UAH finishing third has increased somewhat, and it's now roughly evens if UAH will finish in 3rd or 4th place.
| Rank | Year | Anomaly | Probability | Change |
|---|---|---|---|---|
| 1 | 2016 | 0.51 | 0.00% | -0.00% |
| 2 | 1998 | 0.48 | 0.00% | +0.00% |
| 3 | 2010 | 0.33 | 49.18% | +19.49% |
| 4 | 2015 | 0.27 | 49.54% | -14.75% |
| 5 | 2002 | 0.22 | 1.26% | -4.58% |
| 6 | 2005 | 0.2 | 0.01% | -0.12% |
| 7 | 2003 | 0.19 | 0.00% | -0.02% |
No comments:
Post a Comment